- Lifetime Solutions
VPS SSD:
Lifetime Hosting:
- VPS Locations
- Managed Services
- Support
- WP Plugins
- Concept

Cron is a vital utility in Linux-based systems that allows you to schedule commands or scripts (also called “jobs”) to run automatically at set intervals. This automated scheduling is integral to system administration, minimizing manual effort and ensuring essential tasks like backups, software updates, and log rotations occur reliably and on time.
Crontab, short for “cron table,” is the file where these scheduled tasks are listed. Each line in a crontab file specifies the timing (minute, hour, day of month, month, day of week) and the command or script you want to run. For example, an entry such as:
0 2 * * * /usr/bin/backup.shThis means that the /usr/bin/backup.sh script will run at 2 AM every day, every month, regardless of the day of the week. This simplicity makes Cron indispensable for tasks that keep a server or application healthy, such as database pruning, sending periodic alerts, or rotating old logs.
When these tasks fail or don’t run as expected, the consequences can be severe—data corruption, unpatched vulnerabilities, and more. That’s why crontab logs are crucial. Logs let you confirm whether the job ran as planned, diagnose failures, and keep a robust audit trail of server activity.
This guide will help you understand how crontab logs work in Linux, how to locate and configure them, and how to use them for troubleshooting and performance optimization.
Logs are the heartbeat of any production environment. They capture real-time data about system events, commands, errors, and more, making them essential for debugging and preventive maintenance. Here’s why Cron logs, in particular, are so significant:
Error Detection and Troubleshooting
Cron logs reveal if scheduled tasks ran successfully or encountered errors. If a backup script fails due to a permission issue or a missing command, the logs usually indicate why, enabling a quick fix before more significant problems arise.
Auditing and Security
Checking who added or modified a crontab entry is vital for security. Cron logs help you verify that only authorized tasks are running, and they can also serve as proof during audits to confirm compliance with organizational or regulatory standards.
Performance Monitoring
Reviewing Cron logs over time lets you determine how often tasks run, how long they take, and whether they overlap. This helps schedule tasks during off-peak hours or staggering CPU- or memory-intensive jobs.
Regulatory Compliance
Industries subject to strict regulations (finance, healthcare, etc.) often require meticulous record-keeping. Cron logs contribute to the overall audit trail, helping demonstrate adherence to data handling and security protocols.
Without proper logging, you’re essentially running blind in a production environment. Losing track of Cron jobs can leave you vulnerable to data loss, security breaches, and system instability. The following sections will guide you through discovering where Cron logs reside on your system, how to configure them, and how to put them to use effectively.
Cron operates as a daemon, meaning it runs in the background. It checks crontab files every minute to see if any tasks match the current time. Cron launches the specified command or script if a task is scheduled to run.


Cron uses a restricted environment, so scripts might fail if they assume interactive shell environments or system-wide environment variables. If a script relies on PATH or other variables, specify them within the crontab or the script itself.
Most Linux distributions configure Cron to send its output to syslog. Syslog then records these messages, typically under the “cron” facility, in a dedicated file such as /var/log/cron or merged into /var/log/syslog. Understanding this workflow helps you locate logs quickly and troubleshoot more effectively.

Although the exact log location may differ among distributions, here are some typical spots:
/var/log/syslog (Debian/Ubuntu)
On Debian-based systems like Ubuntu, Cron messages are usually found in /var/log/syslog. Use a grep CRON /var/log/syslog command to filter out Cron-specific entries.

/var/log/cron (CentOS/Red Hat)
Red Hat and CentOS systems frequently separate Cron logs into /var/log/cron. To watch new log entries as they appear, run tail -f /var/log/cron.
/var/log/messages
Older systems or custom configurations might store Cron-related entries in /var/log/messages. Though less common, it’s worth checking if you don’t see them elsewhere.
Systemd Journal (journalctl)
For distributions using systemd, logs may be accessible via journalctl -u cron or journalctl -u crond. This shows only the Cron-related messages from the systemd journal.

Checking rsyslog Configuration
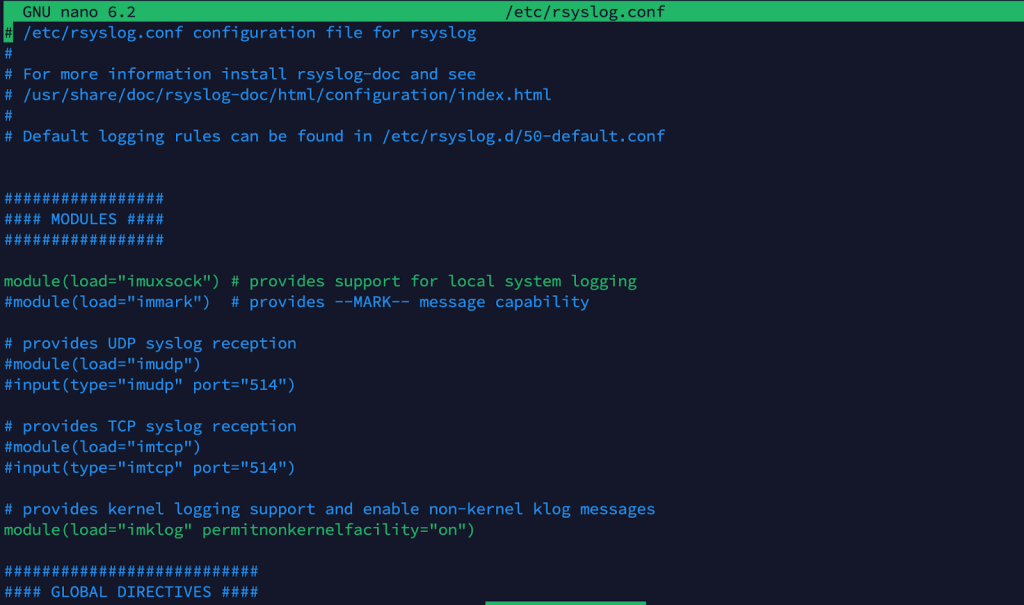
If you still can’t find the logs, inspect /etc/rsyslog.conf or the files under /etc/rsyslog.d/. Look for lines that define the destination of the “cron” facility.

Once you know where Cron sends its logs, monitoring them becomes much more straightforward. You can grep for errors, watch them in real-time, or even ship them to a central logging server.
While most distributions have sane defaults for logging Cron activities, you can refine these settings to meet specific needs—compliance, debugging, or performance tuning.
Open /etc/rsyslog.conf or /etc/rsyslog.d/ files to locate lines referencing “cron.” A typical line might look like:
cron.* /var/log/cron.log
This tells rsyslog to log all Cron messages to /var/log/cron.log. Adjust the file path if you want logs stored elsewhere. Then restart rsyslog:
sudo systemctl restart rsyslogsudo systemctl restart rsyslogYou can control which log levels get recorded. For instance:
cron.err /var/log/cron-error.logIt would capture only Cron error messages. However, be cautious about filtering too aggressively—you might miss crucial information.
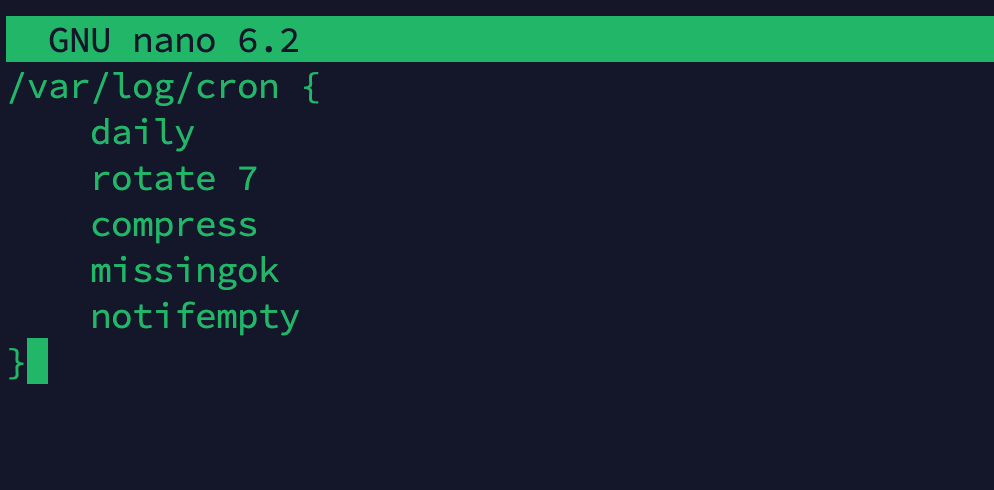
Frequent Cron jobs can generate large logs. Use logrotate (in /etc/logrotate.d/) to rotate them automatically. For example, daily rotation with compression could look like this:
/var/log/cron {
    daily
    rotate 7
    compress
    missingok
    notifempty
}
This rotates the log daily, keeps seven backups, and compresses old logs.
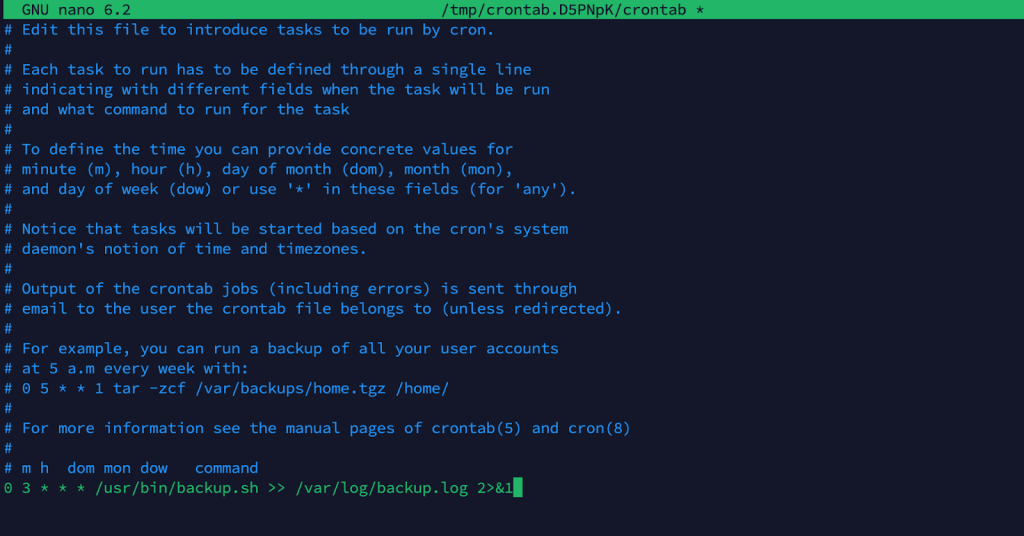
You can route specific job outputs to custom files:
0 3 * * * /usr/bin/backup.sh >> /var/log/backup.log 2>&1This approach isolates logs for critical tasks, making them easier to inspect.
Cron logs often contain sensitive information. Ensure only authorized users can read them:
sudo chmod 600 /var/log/cron
Restricting access helps protect against accidental leaks or malicious use.
By fine-tuning Cron logging, you ensure that the information you need is available when you need it without cluttering the logs or exposing sensitive data.
Once you’ve established a solid foundation for logging, consider these advanced strategies to elevate your monitoring and troubleshooting capabilities.
If you have many servers, forwarding logs to a central location simplifies analysis. You can use Logstash to parse, filter, and ship logs into Elasticsearch, then visualize them in Kibana. This setup is ideal for large-scale environments requiring quick log correlation and searches.
While plaintext logs are easy to read, they can be harder to parse automatically. Outputting logs in JSON or other structured formats simplifies ingestion into analytics tools. For instance, a Cron job could log both a timestamp and structured data like:
{
  "job": "backup",
  "status": "success",
  "timestamp": "2024-12-25T02:00:00Z"
}If a Cron job triggers an application script, review both logs together. Merging or correlating them can reveal where an error truly occurred—whether it was Cron failing to invoke the script or the script’s internal logic failing to complete a task.
Tools like Nagios, Zabbix, or OSSEC let you set triggers for specific log patterns (e.g., “cron error”). Real-time alerts via email, SMS, or Slack can prompt immediate investigation. This approach is beneficial if you rely on Cron for critical production tasks.
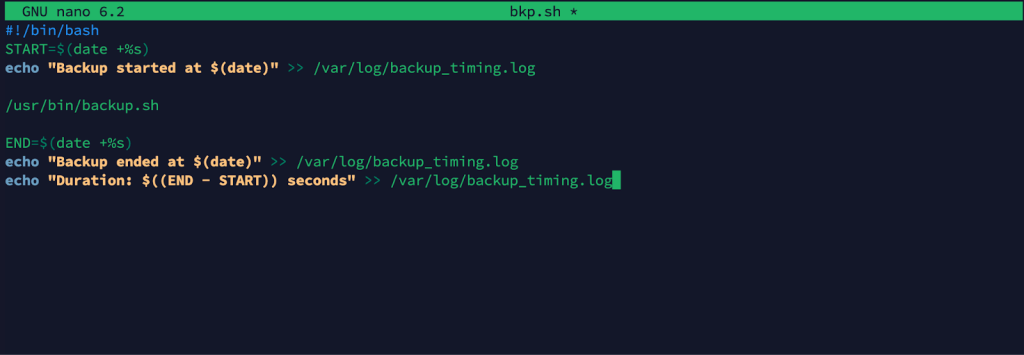
Adding timestamps at the start and end of scripts lets you log execution times:
#!/bin/bash
START=$(date +%s)
echo "Backup started at $(date)" >> /var/log/backup_timing.log

/usr/bin/backup.sh

END=$(date +%s)
echo "Backup ended at $(date)" >> /var/log/backup_timing.log
echo "Duration: $((END - START)) seconds" >> /var/log/backup_timing.log
Charting these durations can reveal performance bottlenecks or help forecast scaling needs.
Advanced logging techniques transform crontab logs from a simple record of events into a powerful observability tool. With the right setup, you can detect anomalies faster, prevent resource conflicts, and better understand your system’s behavior.
Even with a robust logging framework, Cron jobs can fail for various reasons. Recognizing common pitfalls and consulting the logs for clues will significantly streamline your troubleshooting.
Cron doesn’t load the same environment settings as an interactive shell. This can cause “command not found” errors if scripts rely on PATH or other variables. Solutions include using absolute paths (e.g., /usr/bin/python) or defining environment variables explicitly in the crontab file.
Cron jobs run under the user who owns the crontab. If the job needs elevated privileges or attempts to write to restricted directories, you may see “Permission denied” in the logs. Check file ownership with ls -l and adjust permissions accordingly. If a script requires root privileges, place it in the root crontab or carefully use sudo.

A missing asterisk or misplaced comma can prevent a job from running altogether. Always use crontab -e to edit your crontab, and verify you’re specifying the correct format (minute, hour, day of month, month, day of week).

Heavy tasks running simultaneously can exhaust the CPU or memory. Logs might show partial job completions or “Out of memory” errors. To reduce the priority of CPU-intensive jobs, stagger them or consider using system tools like nice or ionice.
By default, Cron emails the output of jobs to the crontab owner if the job produces output. If your mail system isn’t configured correctly, these emails won’t arrive, hiding potential errors. Check mail logs (/var/log/mail.log or /var/log/maillog) to confirm whether the messages are sent.
When you spot errors in the logs, cross-reference them with system data like CPU load, disk usage, or network connectivity. This holistic approach allows you to pinpoint and address the root cause swiftly.
Cron logs may expose command arguments, file paths, and other data attackers can exploit. Therefore, it is paramount to ensure that your logs are secure.
Restrict reading and writing permissions to Cron log files. Only authorized administrators or root should access them. A typical configuration might be:
chmod 600 /var/log/cron
chown root:root /var/log/cronScripts that contain passwords or API keys could inadvertently log them if they fail or print debugging info. Use environment variables, encryption, or secure vault services to protect credentials and ensure they’re never written to logs.
Retaining logs indefinitely can be a liability if they contain sensitive data. Implement a rotation policy that meets compliance standards while minimizing the exposure window. Common practice includes retaining logs for 7 to 30 days, though this depends on organizational or regulatory requirements.
Intrusion detection systems (IDS) like OSSEC or Fail2ban are used to watch for suspicious entries. You’ll receive alerts or automated blocks if someone modifies your crontab unexpectedly or if Cron logs show abnormal behavior.
When using centralized logging, ensure the data is encrypted in transit (e.g., TLS). Unencrypted logs passing through the network can be intercepted, exposing sensitive information.
By implementing these security measures, you ensure that while logs are a rich source of operational data, they don’t become a vulnerability in your infrastructure.
Cron logs aren’t just for catching errors; they offer valuable insights into system performance and resource usage.
Compare Cron job timestamps with system metrics (CPU, memory, disk I/O) from tools like top, vmstat, or iostat. If peak loads coincide with specific jobs, consider rescheduling or optimizing those tasks to avoid performance bottlenecks.

Use timestamps or separate log entries to see how long each job takes. If a job that once ran in a minute starts taking five, it might indicate growing data sets or a hardware issue. This historical data is invaluable for capacity planning.
Some jobs, like backups and updates, can be resource-heavy. If you discover they frequently collide, distribute them more evenly—perhaps one at 1 AM and another at 2 AM. This helps maintain a smoother overall system load.
If logs show that specific tasks are growing in duration or frequency, it may be time to scale up (more CPU, more memory) or scale out (additional servers). This foresight can prevent sudden resource crises.
Platforms like Elastic Stack (ELK) or Splunk can create dashboards to visualize Cron job occurrences and durations. You can set alerts for anomalies, such as a spike in execution time or multiple consecutive failures.
Leveraging Cron logs for performance analysis allows you to optimize schedules, refine resource allocation, and keep your infrastructure running smoothly.
In addition to logging, following certain scheduling best practices can greatly improve the reliability and clarity of your automated tasks.
Replace generic script names (e.g., script.sh) with meaningful ones like db_backup.sh or cleanup_logs.sh. This practice clarifies log entries and makes troubleshooting easier.

Running multiple heavy tasks simultaneously can overwhelm the system. Stagger schedules so that resource-intensive jobs do not collide. For instance, run a backup at 2 AM and a system update at 3 AM instead of both at 2 AM.
Rather than relying solely on Cron logs, your scripts should log or alert on failures internally. For example, they could send an email, write to a specialized log, or trigger an alert in a monitoring system.
Use crontab -l to list and crontab -e to edit your jobs. Keep a version-controlled backup of your crontab to roll back changes if needed. This is especially important in multi-admin environments.
Add explanatory comments:
# Weekly database maintenance
0 1 * * 0 /usr/bin/db_maintenance.sh >> /var/log/db_maintenance.log 2>&1
Comments help you and other administrators understand why a job is scheduled and what it does.
Running a job every minute (* * * * *) can overwhelm your logs and resources unless it’s necessary. Consider alternative approaches like event-driven scripts or systemd timers for more nuanced scheduling.
Combining these best practices with effective logging results in a more organized, secure, well-documented scheduling environment.
While default Linux tools are sufficient for many situations, specialized solutions can further streamline monitoring and analysis.
These monitoring platforms can track Cron logs for error messages and watch system metrics like CPU, memory, and disk usage. You can set thresholds to trigger alerts when a Cron job fails or runs longer than expected.
Logstash can parse Cron logs in real-time, Elasticsearch indexes them, and Kibana provides visualization and alerting. This approach is excellent for large-scale environments requiring advanced search queries and dashboards.
A commercial log management solution that excels at collecting and indexing logs from multiple sources. It offers powerful search capabilities, visualization, and real-time alerting, making it a robust choice if you already use Splunk for other logs.
Prometheus is metrics-focused, but you can create custom exporters for Cron job execution times, success/failure counts, etc. Grafana then visualizes these metrics in dashboards. Although this requires some setup, it’s highly customizable.
A SaaS solution specifically for Cron job monitoring. It pings URLs at the start or end of each Cron job. Cronitor sends alerts via email, SMS, or Slack if a job fails to start or runs too long. This service is ideal for distributed architectures requiring a simple, unified view.
These tools can dramatically reduce manual log analysis and enhance your ability to detect and resolve issues preemptively.
The best way to appreciate crontab logs is to see them in action. Below are common scenarios where logs are critical for both success and troubleshooting.
0 2 * * * /usr/bin/mysqldump -u root -pSecretPassword mydatabase > /var/backups/mydatabase_$(date +\%F).sql 2>> /var/log/db_backup_error.log
This command creates a daily database backup at 2 AM and logs errors to /var/log/db_backup_error.log. Reviewing this file lets you catch issues like connection failures or disk space problems before they escalate.
0 0 * * * /usr/sbin/logrotate /etc/logrotate.conf
Most Linux systems rotate logs nightly. If this fails, you might see errors in /var/log/syslog or /var/log/cron. Failed log rotation can lead to bloated log files consuming disk space.
30 1 * * * sudo apt-get update && sudo apt-get -y upgrade >> /var/log/apt_upgrade.log 2>&1
Update and upgrade logs are stored in /var/log/apt_upgrade.log. You’ll see the error messages here if a package fails to install or a repository is unreachable.
0 8 * * 1-5 /usr/bin/python /home/user/scripts/daily_report.py | mail -s "Daily Report" [email protected]
If the Python script encounters an error, it will appear in /var/log/syslog or /var/log/cron, helping you pinpoint whether the script or the mail command caused the issue.
*/15 * * * * rsync -avz /var/www/ [email protected]:/backup/www/ >> /var/log/rsync_backup.log 2>&1
This command mirrors web files to a remote server, running every 15 minutes. Any network or permission errors are captured in /var/log/rsync_backup.log.
These examples illustrate how logs become an immediate source of truth—letting you see exactly what happened, when, and why.
Even well-structured Cron setups can be taxed by heavy or overlapping jobs. With careful tuning, you can maximize efficiency and system stability.
If two resource-heavy jobs run simultaneously, your server may slow to a crawl. Analyze logs to see when each job runs, then stagger them to avoid collisions.
Reduce a job’s priority to prevent it from monopolizing resources:
0 3 * * * nice -n 10 ionice -c2 -n7 /usr/bin/backup.sh
The nice command lowers CPU priority, while ionice lowers I/O priority, keeping the system responsive during backups.
Instead of one giant script, consider smaller, modular scripts. This reduces the chance of a single point of failure and makes logs more targeted.
You can script a check of the system load before a job runs. If the load is too high, the script can exit or delay until resources are more available. This approach is more complex but can prevent performance bottlenecks.
Configure monitoring tools to alert you if a job’s duration exceeds a certain threshold. This ensures you catch issues early—like unexpectedly large backups or scripts stuck on I/O operations.
Refining how and when Cron jobs run reduces the likelihood of system slowdowns and improves overall reliability.
As infrastructure grows, you may need a more advanced scheduling and logging setup than a single server’s Cron daemon can provide.
Multiple servers, each running Cron, can distribute tasks, but coordinating dependencies and ensuring consistent configurations become challenges. A centralized logging system is vital to maintaining visibility across all servers.
Frameworks like Celery (Python) or Resque (Ruby) use queues to distribute tasks among worker nodes. Cron triggers a minimal job to enqueue tasks, and workers handle them asynchronously. This approach scales more gracefully than relying on a single Cron instance.
Platforms like Kubernetes offer a native “CronJob” resource to schedule tasks across a cluster. Kubernetes handles distribution, retries, and logging integration (via tools like FluentD), removing the single-point-of-failure issue inherent in one server’s Cron.
Cloud providers (AWS Lambda, Google Cloud Functions) allow scheduling serverless tasks. Logs typically reside in CloudWatch or similar services, providing centralized monitoring. This model removes the server management overhead but might introduce new constraints like cold starts or vendor lock-in.
In large systems, logs alone may not suffice. You might need distributed tracing tools like Jaeger or Zipkin to see how a task initiated by Cron propagates through microservices. Combined with logs, this delivers a full-stack view of your application’s health.
Scaling Cron requires balancing complexity, reliability, and visibility. Whichever approach you choose, robust logging remains the cornerstone of operational excellence.
The landscape of infrastructure automation continues to evolve rapidly, and Cron is no exception.
Rather than running tasks on a fixed schedule, event-driven architectures trigger tasks upon specific conditions such as file uploads or database changes. Logs become event-centric, offering a richer context around why a task ran.
Machine learning tools can parse large logs to spot anomalies or predict failures. As these technologies advance, they’ll likely become more accessible for Cron log analysis, automatically correlating factors like load, time of day, or code changes.
In serverless models, tasks are ephemeral. Logging and debugging rely heavily on managed services. Cron functionality often shifts to solutions like AWS EventBridge or Google Cloud Scheduler, with logs aggregated in centralized dashboards.
Zero-Trust mandates more detailed logging and verification, even for internal tasks. You might see Cron logs integrated with authentication data to confirm a script’s identity, ensuring only trusted entities can execute jobs.
Regulatory requirements will continue to tighten. Tools that automate secure log storage, encryption, and long-term retention will become more critical. Cron logs, once an afterthought, will be recognized as a key component of compliance audits.
Staying informed about these trends ensures your Cron-based automation stays resilient, secure, and easy to manage in a rapidly shifting tech environment.
Crontab is a staple in the Linux world for automating tasks that keep systems healthy and efficient. However, the logging layer transforms this foundational tool into a powerful ally for stability, security, and insight.
By internalizing these principles, you’ll be equipped not just to automate tasks with Cron, but to monitor and optimize them with laser precision. The result is a smooth, secure, and high-performing infrastructure that can adapt to the demands of modern computing. Whether you manage a small VPS or a sprawling cloud environment, mastering crontab logs is fundamental to unwavering uptime and reliability.

Vinayak Baranwal wrote this article. Use the provided link to connect with Vinayak on LinkedIn for more insightful content or collaboration opportunities