
The load average is one of the most commonly referenced metrics regarding system performance on Linux. This metric offers a concise overview of how many processes are contending for CPU time. Whether you’re a seasoned system administrator or just starting, understanding the load average is crucial for keeping server performance-optimized and applications running smoothly.
Inbound Marketing Strategy
Helpful tutorials attract qualified visitors, but reliable hosting keeps those readers engaged. Voxfor VPS gives growing websites the speed, uptime, and control needed to support stronger inbound marketing campaigns.
In this comprehensive guide, you’ll learn how to check the load average in Linux. We’ll begin by clearly explaining the load average and why it matters. Next, we’ll dive into specific commands you can run—complete with examples—to measure the load average in real-time. We’ll cover the best practices for interpreting these numbers, provide real-world scenarios, and walk you through troubleshooting steps for high-load situations. We’ll also include frequently asked questions so you feel confident handling load average issues in any Linux environment.
Load average is a metric showing the average number of processes running on the CPU or waiting to run. Linux typically displays three different load average values:
For instance, you might see something like 0.75 1.10 1.02. This means:
Interpreting these averages depends heavily on your system’s resources. A load average 1.0 on a single-core system means the CPU is fully utilized. On a system with four CPU cores, a load average of 4.0 might indicate it’s fully loaded. Therefore, the “right” or “safe” load average is always relative to your system’s many cores.
Understanding the load average is the first step. Next, learn how to check it using various commands and tools.
Linux uses an exponential moving average to compute the 1-minute, 5-minute, and 15-minute load averages. In simple terms, the kernel periodically measures how many processes are running or waiting for CPU and updates a running average. More recent data has a higher weight, so the 1-minute average changes faster than the 15-minute one.
Crucially, Linux counts tasks in an uninterruptible sleep state (often waiting on I/O) as part of the load. That means if your system is waiting on disk or network operations, the load average can go up even if the CPU itself isn’t at 100% usage.
Usage:
uptimeSample Output:

08:15:23 up 2 days, 5:40, 2 users, load average: 0.03, 0.05, 0.07uptime is a quick and lightweight command, ideal for scripts or rapid checks when you need to see the load averages (and your system’s uptime) in one line.
Usage:
top
When you run top, you enter an interactive interface that refreshes every few seconds:
Press:
Sample top line from top:
top - 08:16:02 up 2 days, 5:41, 3 users, load average: 0.10, 0.03, 0.02Here, again, are your three load average values: 0.10 (1-minute), 0.03 (5-minute), and 0.02 (15-minute). top is invaluable for diagnosing short-term spikes because you can see which processes are eating CPU or if any are stuck in I/O wait.
If you prefer a more modern interface, try htop. It’s not installed by default on all distributions, so you might need to install it:
Installation (Debian/Ubuntu):
sudo apt-get update
sudo apt-get install htop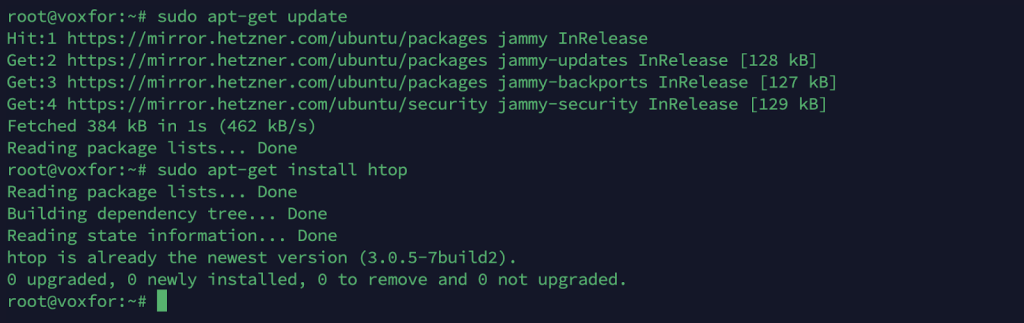
Installation (CentOS/RHEL):
sudo yum install htopUsage:
htop
You’ll get:
Navigation is more intuitive with htop; you can scroll through processes with arrow keys, kill them with fewer keystrokes, and filter them more quickly than on top. Look at the top bars or the panel around the screen’s top center for quick load average checks.
To integrate load average checks into scripts, reading /proc/loadavg directly is very convenient:
Usage:
cat /proc/loadavgSample Output:

0.03 0.05 0.07 1/100 12345Here’s what each field means:
This is perfect for automation or custom monitoring scripts. Set up a cron job or use a monitoring agent that reads these values regularly and triggers alerts when certain thresholds are crossed.
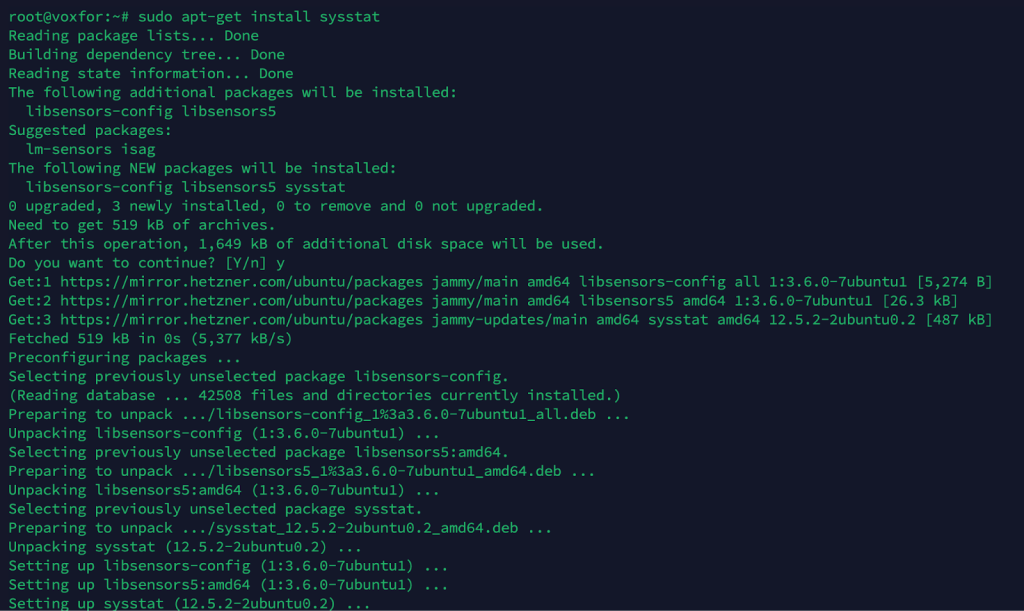
sudo apt-get install sysstat # Debian/Ubuntu
iostat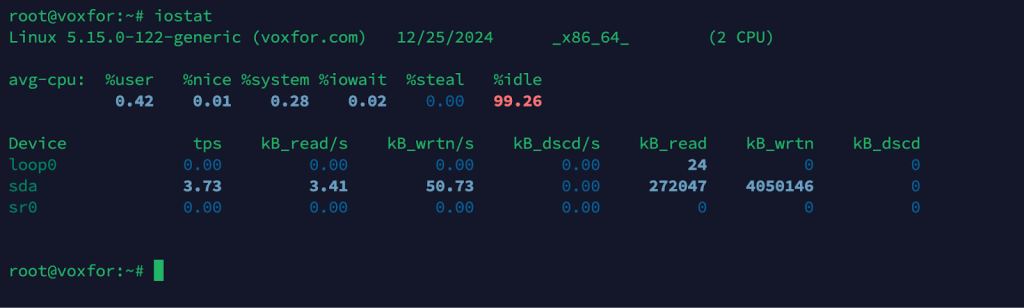
Displays CPU and I/O statistics, helping you check if high load is related to heavy disk usage.
sudo apt-get install iotop # Debian/Ubuntu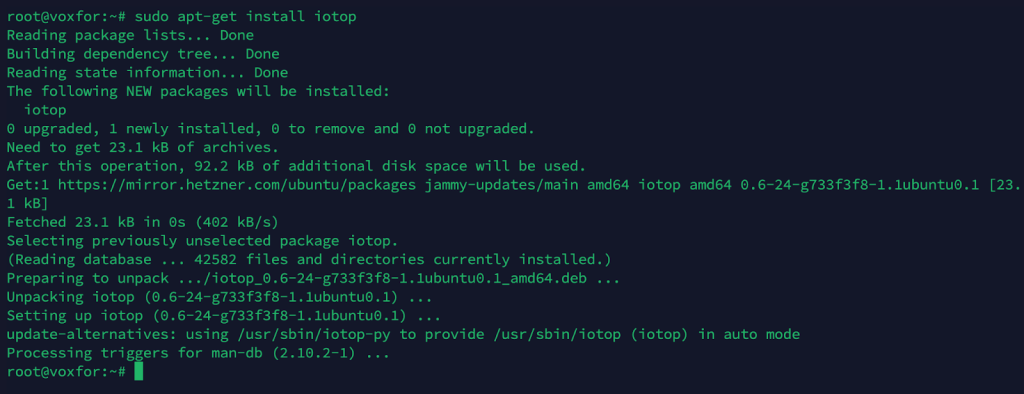
iotop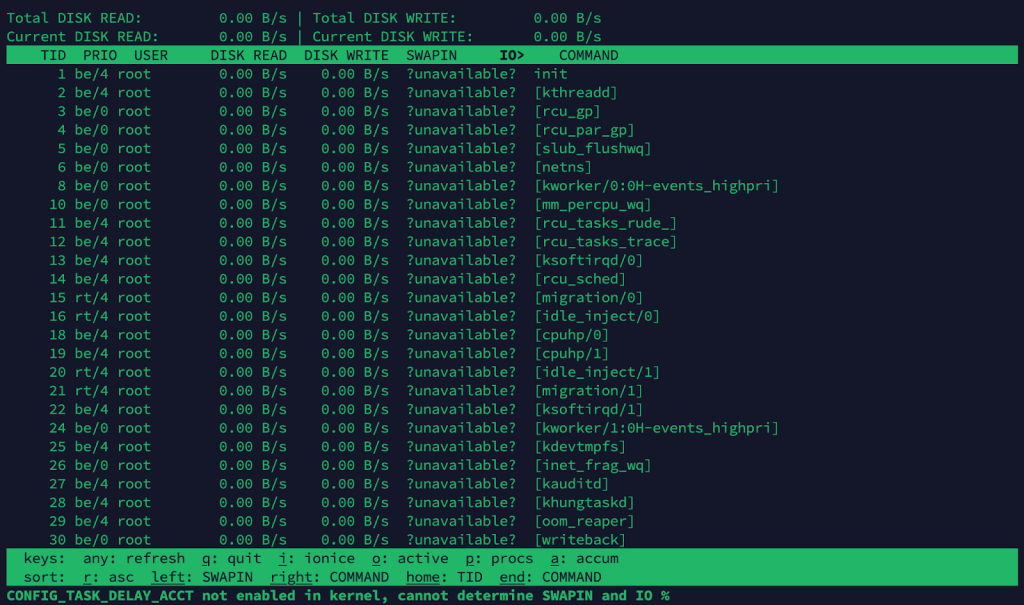
Shows a real-time view of which processes are performing I/O operations.
vmstat 1 5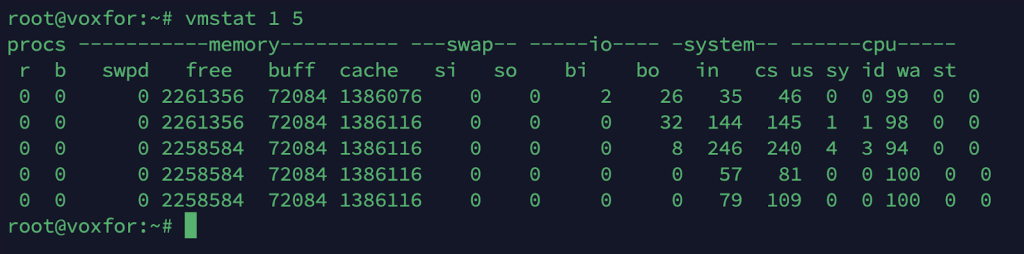
Reports statistics about processes, memory, paging, block I/O, interrupts, and CPU activity.
Each tool has its strengths. The more complex your environment, the more likely you’ll want a comprehensive monitoring stack correlating load average with CPU, memory, disk, and network metrics over time.
There’s no universal “ideal” load average, but here are rough guidelines:
Ultimately, the tolerance for a given load depends on workload types, application sensitivity, and system resources.
uptimeReturns:

08:25:11 up 14 days, 3:52, two users, load average: 2.85, 1.30, 0.95
On a 2-core web server, a 1-minute load average of 2.85 might mean a traffic burst temporarily overloads the server. It was likely a short spike if it quickly subsided to around 1.30. If it remains above 2.0 consistently, you may need load balancing or more capacity.
top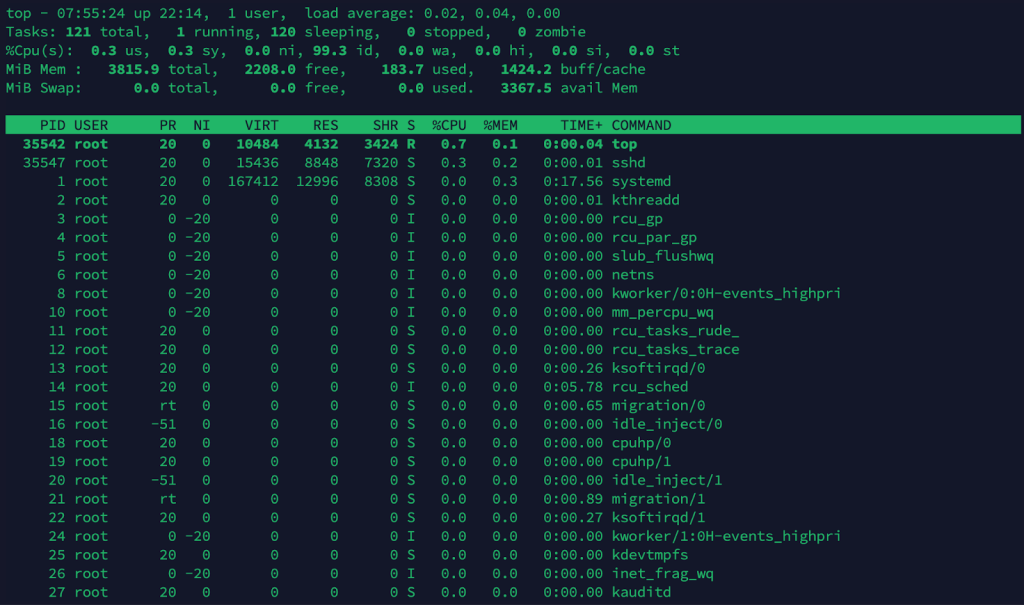
Shows a load average of 12.00, 10.50, 9.80 on an 8-core server. That’s around 1.5 processes per core. If queries are slow, it’s time to investigate indexing, query optimization, or possibly adding CPU resources.
htop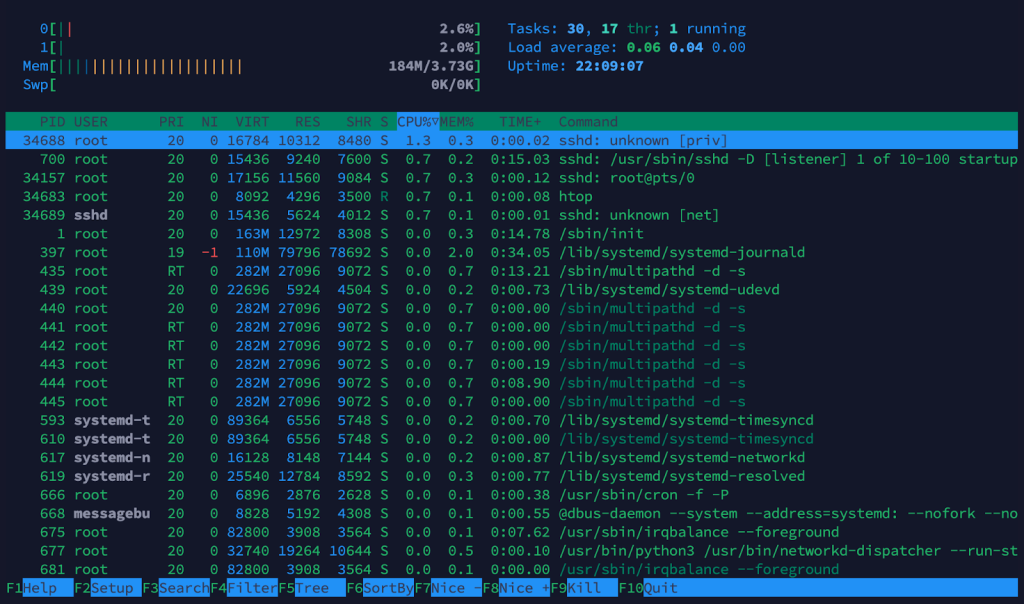
This indicates a load average 4.00 on a 4-core CI/CD build server. This might be normal if a few concurrent build jobs are running. Once the builds are complete, the load average drops.
Each scenario emphasizes context. The same raw load average value can be worrisome in one environment and entirely acceptable in another.
You can manage load averages even during peak demand by tailoring these strategies to your specific environment.
Myth: High Load Average = High CPU Usage
High load can also come from tasks waiting on slow disk or network I/O. If the top shows low CPU usage but your load average is high, you likely have an I/O bottleneck.
Myth: One Magic Threshold
No single load average threshold applies to every system. A load average 2.0 can be huge on a single-core machine and insignificant on an 8-core server.
Myth: Load Average Only Matters on Dedicated Servers
Virtualized environments also exhibit load averages, but remember that the hypervisor schedules CPU time for the VM. A “high” load in a VM might be due to the hypervisor limiting CPU cycles.
Myth: Load Average = CPU
CPU usage is a narrower metric. Load average includes waiting processes, even if the CPU isn’t currently busy.
Myth: Monitoring Load Average Alone Is Enough
Memory, disk performance, and network throughput all matter equally. For a full health check, always consider multiple metrics.
By isolating each possible cause, you can quickly determine whether you need more hardware, better configurations, or a code fix.
A holistic performance strategy helps prevent surprises and keeps your average load healthy.
Mastering how to check the load average in Linux is fundamental to maintaining a performant and stable system. By knowing the key commands—such as uptime, top, htop, and reading from /proc/loadavg—you can quickly gauge the stress level on your CPU (and sometimes I/O) and take immediate action when needed.
However, raw numbers alone don’t tell the whole story. You must interpret the load average relative to your CPU core count and the nature of your workloads. Monitoring tools like Prometheus, Grafana, Nagios, or Zabbix can collect historical data to help you spot trends and set alerts for unusual spikes.
Remember that the load average is just one piece of the performance puzzle. Disk, memory, and network resources all play critical roles. The high load could come from CPU saturation but could also result from slow disk writes, insufficient memory, or a backlog of network requests.
With the strategies outlined here—caching, load balancing, scaling, and ongoing monitoring—you can keep your systems running smoothly. Whether you manage a web server, a database, or a CI/CD pipeline, these load average insights will help you optimize performance, reduce downtime, and ensure that your Linux environments remain healthy and responsive.
There’s no single number that’s universally good. You generally want your load average lower than your total CPU cores. For a 4-core system, staying under 4.0 is usually safe. Many admins prefer staying around 70% of core capacity (e.g., under 2.8 for a 4-core).
Not necessarily. The load average counts processes waiting on I/O as well. If your CPU usage is low but the load average is high, you likely have processes stuck in disk or network I/O wait.
On Debian/Ubuntu:
sudo apt-get update
sudo apt-get install htop iotop sysstat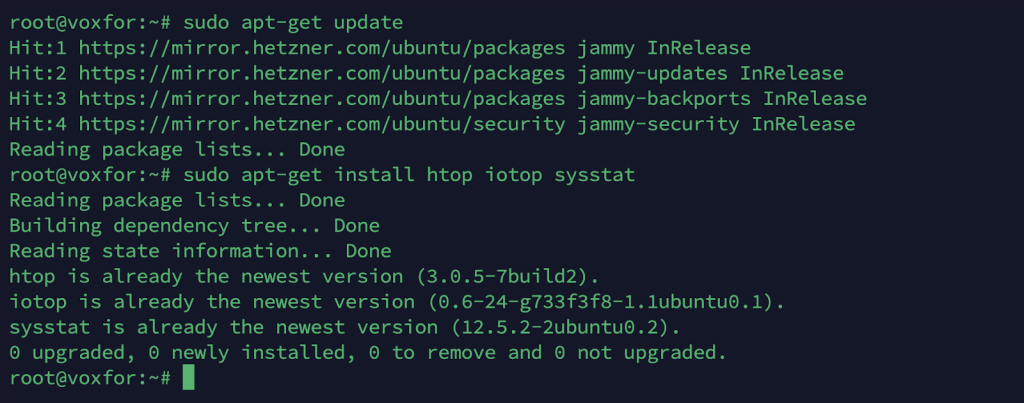
sudo yum install htop iotop sysstatuptime is excellent for a glance, while the top (or htop) provides interactive, detailed information about ongoing processes. Use both, depending on whether you need a snapshot or a real-time view.
A brief spike may not be an issue if performance remains acceptable. However, a sustained load above core capacity indicates that processes are queuing. You should investigate and optimize or scale resources.
It might help if your tasks are truly CPU-bound. But if the bottleneck is I/O, network latency, or poorly optimized code, adding CPU cores alone won’t fix the root cause.
Use iostat or iotop to see if the disk is heavily used. Also, check %wa (iowait) in top or htop. A high io wait value indicates bottlenecks from disk or network operations.
Yes. In a virtualized environment, the hypervisor schedules CPU time among multiple VMs. A VM’s load average might be high due to shared CPU resources or throttling. Always compare the host node’s load with other VMs to see if the host is overcommitted.
That could be a routine job or cron task causing batch processing. Checking system logs and cron schedules can confirm. You might reschedule tasks to distribute the load or allocate more resources during high-demand periods.
No. While it’s an excellent leading indicator, you should also track CPU usage, memory (RAM and swap), disk I/O, network traffic, and application logs for a comprehensive view.
Are you looking for a hardware upgrade to maintain optimal load averages? Check out our Best VPS for Low Load Average for your VPS Requirements.

Vinayak Baranwal wrote this article. Use the provided link to connect with Vinayak on LinkedIn for more insightful content or collaboration opportunities


 Lifetime Hosting
 France Lifetime Dedicated Servers
 Germany Lifetime dedicated servers
 Lifetime Game Dedicated Servers
 Chicago, US
 Singapore
 Hong Kong
 Seoul, South Korea
 Amsterdem, Netherlands
 London, UK
 Zurich, Switzerland
 Sydney, Australia
 DDOS Protection
 Submit Ticket
 Full Management
 Videos and Podcasts
 Voxfor Advanced Price Management For WooCommerce
 Voxfor AI Content Summary


