- Lifetime Solutions
VPS SSD:
Lifetime Hosting:
- VPS Locations
- Managed Services
- Support
- WP Plugins
- Concept

Have you ever tried to access a webpage that appears to be completely loaded, then the page responds by not letting you press any buttons or fill in forms or go up and down the page? That irritating experience is usually due to inadequate Time to Interactive (TTI), one of the vital performance metrics, which is the time taken by a customer to actually interact with your webpage. Although Lighthouse 10 has outgrown TTI, the optimization strategies that enhance TTI are still needed to provide fast and responsive websites that are acceptable to users and search engines.

Time to Interactive is the period when a webpage starts loading up until it is responsive to user interaction. TTI, unlike measures of visual appearance, places emphasis on functional preparation, the state when users can press buttons, submit forms, scroll without lag, and touch page objects without lag or unresponsiveness.
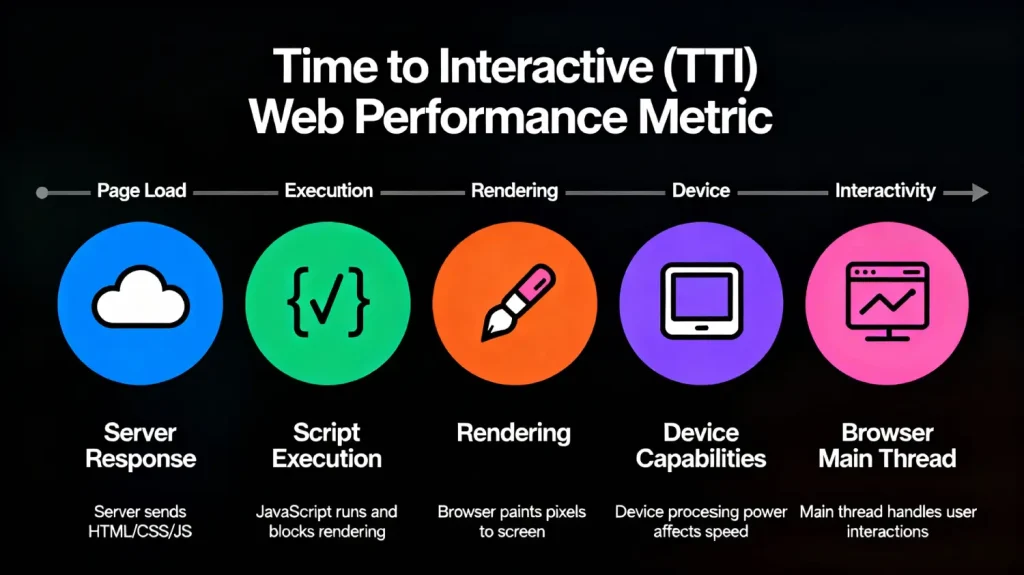
TTI encompasses several interconnected factors:
A webpage achieves full interactivity when the browser’s main thread becomes “quiet”—meaning long-running JavaScript tasks no longer block it and can immediately respond to user actions.
The technical definition of TTI involves finding a “quiet window” in browser activity:
This methodology explains why TTI is sensitive to JavaScript execution and network activity, both can delay the quiet window and push TTI higher.
Understanding what constitutes good, moderate, and poor TTI helps you set appropriate optimization targets:
| TTI Score | Rating | User Experience |
| 0–3.8 seconds | Good (Green) | Users can interact almost immediately |
| 3.9–7.3 seconds | Moderate (Orange) | Noticeable delay before interaction |
| Over 7.3 seconds | Poor (Red) | Frustrating wait times, high abandonment risk |
A TTI under 3 seconds is considered optimal for most websites, though complex web applications may require longer load times while still delivering acceptable user experiences.
Important Update: Time to Interactive was removed from Lighthouse 10 in February 2023. Google determined that TTI was “overly sensitive to outlier network requests and long tasks,” making it less reliable than newer metrics.
The TTI weight (previously 10% of the Lighthouse performance score) was redistributed to Cumulative Layout Shift (CLS), increasing CLS’s weight to 25%.
Following the March 2026 update, the Core Web Vitals that directly impact Google rankings are:
| Metric | What It Measures | Good Threshold |
| Largest Contentful Paint (LCP) | Loading performance | Under 2.5 seconds |
| Interaction to Next Paint (INP) | Responsiveness to all interactions | Under 200 milliseconds |
| Cumulative Layout Shift (CLS) | Visual stability | Under 0.1 |
Interaction to Next Paint (INP) replaced First Input Delay (FID) as the responsiveness metric. While FID only measured the delay of the first interaction, INP measures responsiveness throughout the entire page session—providing a more comprehensive view of user experience.
Despite TTI’s deprecation from Lighthouse scoring, the optimization techniques that improve TTI directly benefit the metrics that do count:
Optimizing for TTI essentially optimizes for overall page responsiveness and user experience.
Understanding the differences between these responsiveness metrics helps you target optimizations effectively:
| Aspect | Time to Interactive (TTI) | First Input Delay (FID) | Interaction to Next Paint (INP) |
| What it measures | Time until the page is fully interactive | Delay before the first interaction response | Latency of all interactions throughout the session |
| Measurement type | Lab metric | Field metric | Field metric |
| Interactions covered | Overall page readiness | First interaction only | All clicks, taps, and keyboard inputs |
| Current status | Deprecated from Lighthouse 10 | Replaced by INP (March 2026) | Current Core Web Vitals |
| Good threshold | Under 3.8 seconds | Under 100 milliseconds | Under 200 milliseconds |
Key insight: INP is now the primary responsiveness metric because it captures user experience throughout the entire page visit, not just the initial load or first interaction.

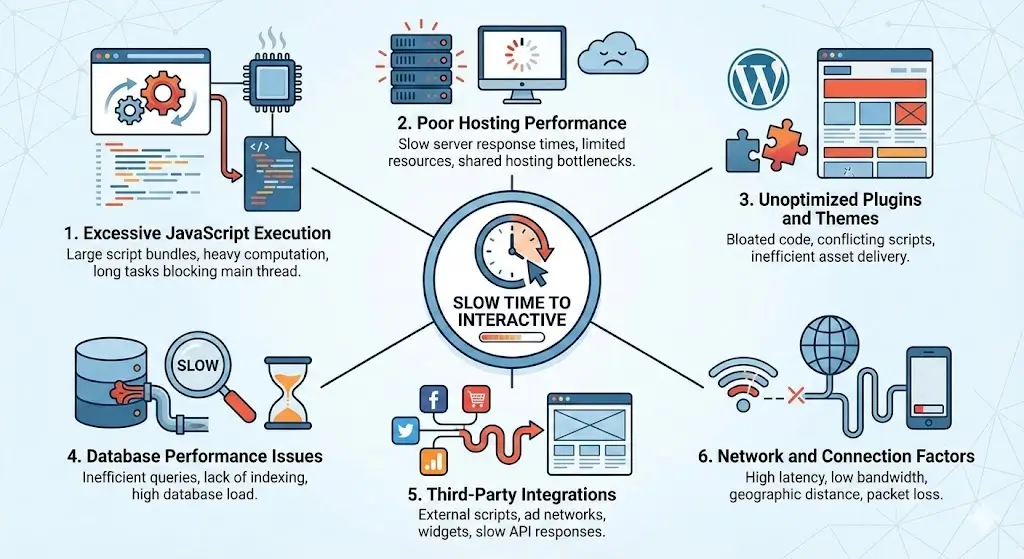
Delayed interactivity is caused by a number of factors. By determining which ones are relevant to your site, you can do specific optimization.
JavaScript is the primary culprit behind slow TTI. When the browser’s main thread is occupied parsing, compiling, and executing JavaScript, it cannot respond to user input.
Common JavaScript problems:
Your hosting infrastructure directly impacts server response time and resource delivery:
In the case of WordPress and other CMS applications, both performance and speed are greatly affected by the presence of thousands of plugins and themes.
Slow database queries delay server response time, pushing back when content delivery begins:
External services introduce dependencies outside your control:
User-side factors also affect perceived interactivity:
Although TTI is no longer part of Lighthouse scoring, you can still measure it using various tools to understand your page’s interactivity timeline.
PageSpeed Insights has lab data (Lighthouse) as well as field data (Chrome User Experience Report). Although TTI does not feature in the primary metrics anymore, other indicators that are related to TTI, such as TBT and LCP, are still visible.
How to use:
GTmetrix continues displaying TTI in its reports, though it clarifies the metric no longer affects performance scoring:
Chrome’s built-in developer tools offer detailed performance analysis:
WebPageTest supports waterfall charts and filmstrip views, which enable you to see when your page actually starts being interactive:
To enhance TTI, it is necessary to work on JavaScript execution, critical rendering path optimization, and lessen main thread work. The following are best practices based on the impact area.
The critical rendering path represents the sequence of steps browsers take to convert HTML, CSS, and JavaScript into rendered pixels. Optimizing this path directly improves TTI.
Minimize render-blocking resources:
Render-blocking resources (typically CSS and synchronous JavaScript in the document head) prevent the browser from rendering content until they’re fully downloaded and processed.
<!-- Instead of render-blocking CSS -->
<link rel="stylesheet" href="styles.css">

<!-- Use media queries to conditionally load non-critical CSS -->
<link rel="stylesheet" href="print.css" media="print">
<link rel="stylesheet" href="large-screen.css" media="(min-width: 1200px)">
Inline critical CSS:
Extract CSS required for above-the-fold content and inline it directly in the HTML document. This eliminates the render-blocking request for external CSS files.
<head>
  <style>
    /* Critical CSS for above-the-fold content */
    header { background: #fff; padding: 20px; }
    .hero { font-size: 2rem; color: #333; }
  </style>

  <!-- Load remaining CSS asynchronously -->
  <link rel="preload" href="styles.css" as="style" onload="this.onload=null;this.rel='stylesheet'">
</head>Controlling when JavaScript loads and executes dramatically impacts TTI.
Defer non-critical scripts:
The defer attribute tells the browser to download scripts in parallel but execute them only after HTML parsing completes:
<script defer src="analytics.js"></script>
<script defer src="social-widgets.js"></script>
Deferred scripts execute in order, making them suitable for scripts with dependencies.
Async for independent scripts:
The async attribute downloads scripts in parallel and executes them immediately when ready, regardless of HTML parsing status:
<script async src="https://www.googletagmanager.com/gtag/js?id=GA_TRACKING_ID"></script>Use async for independent scripts without dependencies on other code.
Comparison:
| Attribute | Download | Execution | Best For |
| None | Blocks parsing | Immediate | Critical, required scripts |
| async | Parallel | When ready | Independent third-party scripts |
| defer | Parallel | After HTML parsing | Non-critical scripts with dependencies |
Code splitting breaks large JavaScript bundles into smaller chunks, loading only what’s needed for the current page.
Benefits:
Implementation approaches:
Route-based splitting: Load JavaScript specific to each page route
javascript
// React example with dynamic imports

const HomePage = React.lazy(() => import('./pages/HomePage'));
const ProductPage = React.lazy(() => import('./pages/ProductPage'));
Component-based splitting: Load heavy components only when needed
// Load the modal component only when the user clicks

button.addEventListener('click', async () => {
  const { Modal } = await import('./components/Modal');
  Modal.open();
});Audit your codebase to identify and eliminate JavaScript that never executes.
Using Chrome DevTools Coverage:
Tree shaking: Modern bundlers (Webpack, Rollup, esbuild) can automatically remove unused exports from your JavaScript bundles when using ES6 module syntax.
WordPress-specific: Use plugins like Perfmatters or Asset CleanUp to disable JavaScript files on pages that don’t need them.
Minification removes unnecessary characters (whitespace, comments, line breaks) without changing functionality:
Before minification:
javascript

// Calculate the total price
function calculateTotal(items) {
  let total = 0;
  for (let item of items) {
    total += item.price * item.quantity;
  }
  return total;
}
After minification:
function calculateTotal(e){let t=0;for(let l of e)t+=l.price*l.quantity;return t}Compression: Your server should be enabled to compress files using Gzip or Brotli to additionally minimize the size of files being transferred. On text-based resources, Brotli will normally obtain 15-25% higher compression than Gzip.
Resource hints help browsers discover and fetch critical resources earlier.
Preload: Forces immediate download of critical resources:
<head>
  <link rel="preload" href="critical-script.js" as="script">
  <link rel="preload" href="hero-image.webp" as="image">
  <link rel="preload" href="main-font.woff2" as="font" type="font/woff2" crossorigin>
</head>Preconnect: Establishes early connections to important third-party origins:
xml
<link rel="preconnect" href="https://fonts.googleapis.com">
<link rel="preconnect" href="https://cdn.example.com">
Preconnect handles DNS lookup, TCP handshake, and TLS negotiation, saving 100-500ms per connection.
DNS-prefetch: Performs only DNS resolution (lighter than preconnect):
<link rel="dns-prefetch" href="https://analytics.example.com">Use dns-prefetch for less critical origins where full preconnect overhead isn’t justified.
The principal thread performs the parsing of HTML/CSS, execution of JavaScript, computations of the layout and processing of user input. Interactivity is slowed by overloading it.
Break up long tasks:
Long tasks (exceeding 50ms) block the main thread. Break them into smaller chunks using setTimeout or requestIdleCallback:
javascript
// Instead of processing everything at once

function processLargeArray(items) {
  const chunkSize = 100;
  let index = 0;
  function processChunk() {
    const chunk = items.slice(index, index + chunkSize);
    chunk.forEach(processItem);
    index += chunkSize;
    if (index < items.length) {
      setTimeout(processChunk, 0); // Yield to main thread
    }
  }
  processChunk()
}
Use Web Workers:
Web Workers execute JavaScript in separate threads, preventing the main thread from blocking:
// main.js

const worker = new Worker('heavy-computation.js');
worker.postMessage({ data: largeDataset });
worker.onmessage = function(e) {
  console.log('Result:', e.data);
};
// heavy-computation.js (Web Worker)
self.onmessage = function(e) {
  const result = performHeavyComputation(e.data);
  self.postMessage(result);
};
Web Workers are ideal for:
Third-party scripts can also be a major source of main thread blocking. Implement these strategies:
Load asynchronously:
xml
<script async src=”https://www.googletagmanager.com/gtag/js?id=GA_ID”></script>
Delay until user interaction:
javascript
// Load chat widget only after user scrolls or clicks

let chatLoaded = false;
function loadChatWidget() {
  if (chatLoaded) return;
  chatLoaded = true;
  const script = document.createElement('script');
  script.src = 'https://chat-widget.example.com/widget.js';
  document.body.appendChild(script);
}
window.addEventListener('scroll', loadChatWidget, { once: true });
document.addEventListener('click', loadChatWidget, { once: true });
Self-host when possible:
Third-party scripts hosted on your server or CDN will remove DNS search and connection establishment delays to other domains.
Use facades:
Replace heavy embeds with lightweight placeholders that load the full content on interaction:
xml
<!-- Lightweight YouTube facade -->

<div class="youtube-facade" data-video-id="VIDEO_ID">
  <img src="youtube-thumbnail.jpg" alt="Video title">
  <button class="play-button">Play Video</button>
</div>

<script>
document.querySelector('.youtube-facade').addEventListener('click', function() {
  const videoId = this.dataset.videoId;
  this.innerHTML = `<iframe src="https://www.youtube.com/embed/${videoId}?autoplay=1" allowfullscreen></iframe>`;
});
</script>Although CLS is an independent Core Web Vital, layout shift reduction also helps to increase the perceived interactivity since unexpected content movement is avoided.
Reserve space for dynamic content:
xml
<!-- Specify dimensions for images -->
<img src="product.jpg" width="400" height="300" alt="Product">
<!-- Reserve space for ads -->

<div style="min-height: 250px;">
  <!-- Ad container -->
</div>
Avoid inserting content above existing content:
Adding elements dynamically should be done as they appear below the existing viewport or apply CSS transforms rather than layout-affecting properties.
Faster server response (Time to First Byte) gives the browser more time budget for rendering and JavaScript execution.
Implement server-side caching:
Use a Content Delivery Network (CDN):
CDNs serve content from edge servers geographically closer to users, reducing latency.
Optimize database queries:
Upgrade hosting:
Consider managed hosting solutions optimized for your platform (WordPress, Laravel, etc.) that include:
WordPress sites face unique challenges due to the plugin ecosystem and theme architecture.
Avoid themes packed with features you won’t use. Look for:
Recommended lightweight themes: GeneratePress, Astra, Kadence, Neve
Caching plugins: WP Rocket, FlyingPress, LiteSpeed Cache
JavaScript optimization: Flying Scripts, Perfmatters
Large images compete for bandwidth and delay other resources:
Time to Interactive remains a valuable concept for understanding web performance, even after its deprecation from Lighthouse scoring. The core principle, ensuring users can interact with your page quickly and without frustration, is fundamental to good user experience and SEO performance.
Start by measuring your current performance with tools like PageSpeed Insights and GTmetrix, identify the biggest opportunities in your Lighthouse report, and systematically address each issue. Focus particularly on JavaScript optimization, as it typically offers the largest performance gains for interactive responsiveness.

Hassan Tahir wrote this article, drawing on his experience to clarify WordPress concepts and enhance developer understanding. Through his work, he aims to help both beginners and professionals refine their skills and tackle WordPress projects with greater confidence.