Lifetime VPS Europe
 Lifetime VPS Asia
 Lifetime WooCommerce Hosting
 Lifetime Hosting
 Lifetime Game Dedicated Servers
 Chicago, US
 Tokyo, Japan
 Singapore
 Hong Kong
 Seoul, South Korea
 Amsterdem, Netherlands
 London, UK
 Stockholm, Sweden
 Oslo, Norway
 Vienna, Austria
 Zurich, Switzerland
 Sydney, Australia
 Wordpress Hosting
 VPS Hosting
 DDOS Protection
 Submit Ticket
 Full Management
 Guides
 Videos and Podcasts
 Discover Creative Ideas
 Voxfor Autonomous AI Workers
 Voxfor Mega Menu
 Voxfor Advanced Price Management For WooCommerce
 Voxfor Secure Live Chat and AI Support
 Voxfor Multilanguage
 Voxfor AI Content Summary
 Voxfor Autopilot
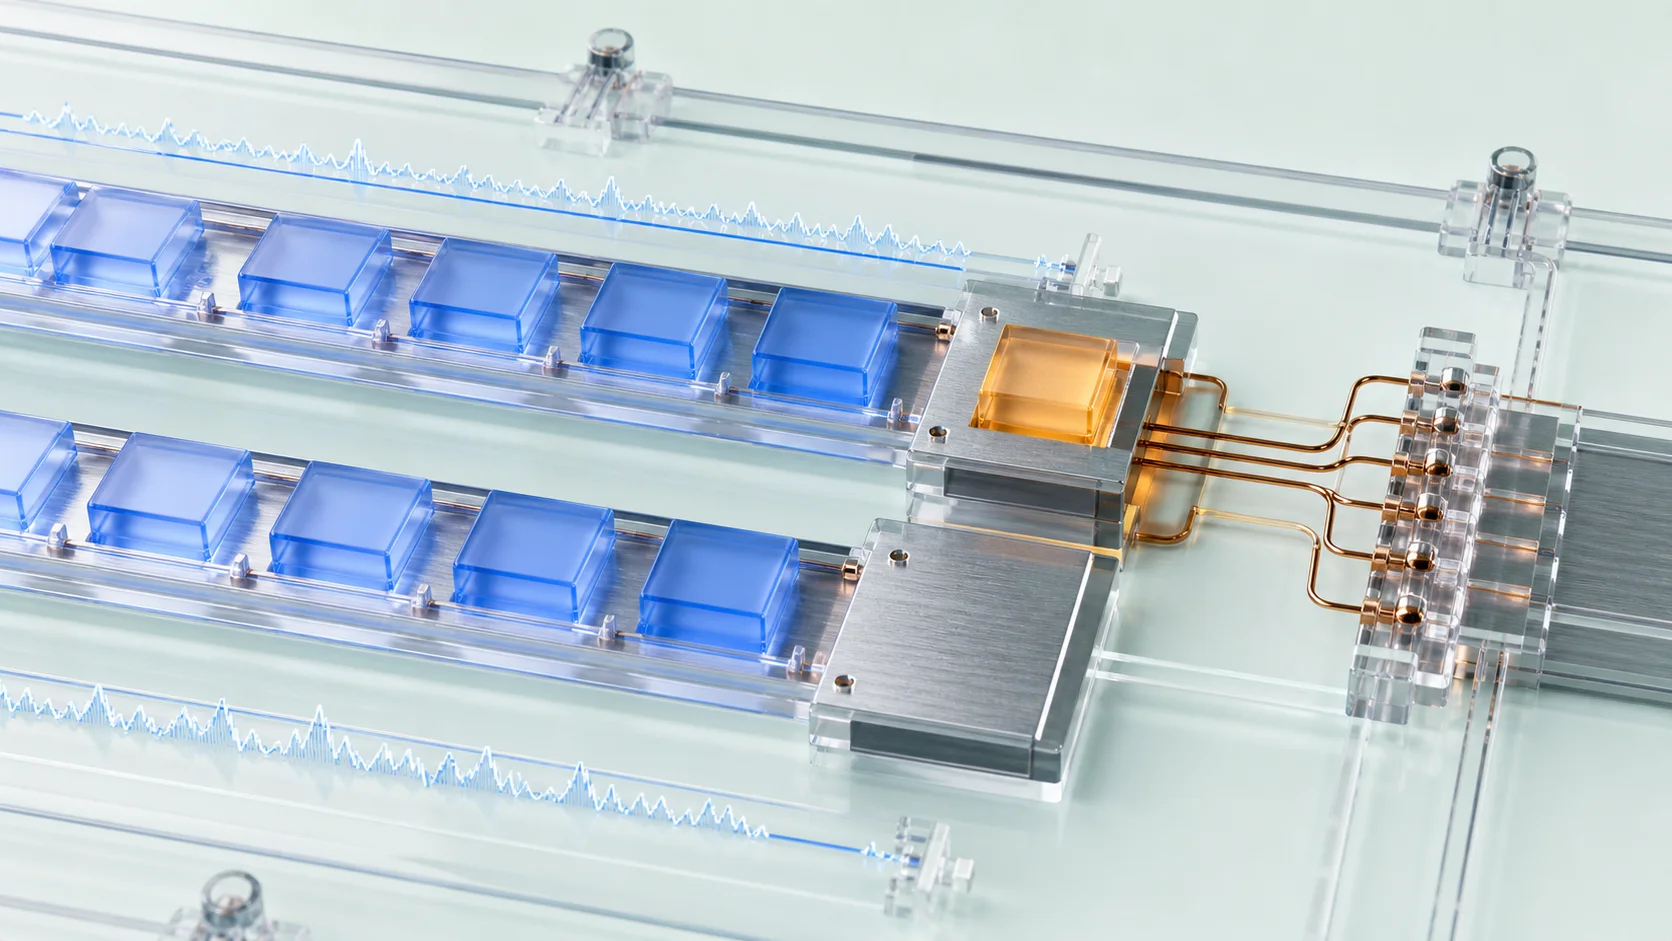
CPU steal time is the share of time a virtual CPU was ready to work but could not run because the hypervisor was servicing another virtual processor. On a slow VPS, a sustained rise in %steal can explain latency that is invisible in an application-only dashboard. The safe response is to sample it over time, compare it with guest demand and application latency, rule out plan limits, and keep evidence before resizing or moving.
One top screenshot is not proof of a noisy neighbor. Steal time records unavailable virtual CPU time; it does not identify which VM, host policy or scheduling decision caused it. Treat it as a diagnostic signal that becomes useful when a repeatable symptom and other measurements agree.
Quick Decision
| What you observe | Likely direction | Next check |
|---|---|---|
High %usr or %sys, little %steal |
The guest is consuming its allocated CPU | Find the process, query or worker causing demand |
Repeated %steal during latency while guest work is runnable |
Hypervisor scheduling may be withholding vCPU time | Capture per-vCPU samples and provider context |
High %iowait, little %steal |
Storage latency or blocked I/O is more likely | Inspect disk latency, queue depth and database waits |
| CPU slows after sustained bursts on a burstable plan | CPU credits or a provider cap may apply | Check the provider’s credit and throttling metrics |
| One isolated steal spike with no user impact | Not enough evidence for a migration | Establish a baseline and monitor recurrence |
The Linux mpstat manual defines %steal as involuntary wait by a virtual CPU while the hypervisor services another virtual processor. That definition matters: it is different from a process voluntarily sleeping, a CPU waiting around an I/O request, or an application using all of its own allocation.
Understand What the Guest Can and Cannot See
Linux exposes CPU states from inside the guest. User time shows application work; system time shows kernel work; idle indicates no runnable work without outstanding I/O; iowait relates to idle time with an outstanding disk request; steal represents virtual CPU time the guest wanted but did not receive.
| CPU field | What it represents | Common wrong conclusion |
|---|---|---|
%usr |
Application code running in user space | Every high value means the VPS is undersized |
%sys |
Kernel work | The application is always responsible |
%iowait |
Idle CPU time while I/O is outstanding | The CPU itself is slow |
%steal |
Involuntary vCPU wait at the virtualization layer | A particular neighboring customer has been proven guilty |
%idle |
CPU had no runnable work and no outstanding I/O | The whole system must be healthy |
The kernel’s /proc/stat documentation describes steal as time spent in other operating systems while the machine is a virtualized guest. Its counters are cumulative. Reading field eight once gives a total since boot, not a current percentage, which is why interval sampling is more useful during an incident.
Voxfor’s KVM and hypervisor guide explains the VM boundary from a buyer’s perspective. This guide starts one layer later: the VPS already exists, the workload is slow, and the operator needs evidence about where CPU time disappeared.
Reproduce the Symptom Before Sampling
A clean measurement window needs a known event. Record the UTC time, affected endpoint or job, expected latency, observed latency and whether a deployment or traffic change just occurred. If the slowdown cannot be reproduced, collect a longer baseline rather than generating artificial load on production.
Begin with safe, read-only context:
date -u
uptime
nproc
free -h
ps -eo pid,comm,%cpu,%mem --sort=-%cpu | head -n 15
These commands tell you whether the guest already has a CPU-hungry process, load queue or memory problem. High load with busy application processes points inward. High latency with modest guest CPU plus repeated steal is a different pattern, but it still needs a time series.
Avoid restarting the VPS before collecting this evidence. A reboot discards the immediate process state and may move the VM or temporarily clear the symptom, leaving only a story instead of measurements.
Capture Per-vCPU Steal Time with mpstat
On Debian or Ubuntu, mpstat is provided by the sysstat package. Install it through the normal package workflow if it is absent and change policy permits it; otherwise use an already approved metrics agent or vmstat. Then capture repeated samples rather than a boot average:
sudo apt-get update
sudo apt-get install -y sysstat
LC_ALL=C mpstat -P ALL 5 60
This collects five-minute evidence at five-second intervals. CPU all is the aggregate; the numbered rows show each virtual CPU. Averages can hide one repeatedly delayed vCPU, especially when an application pins a busy worker or the scheduler concentrates runnable work on a subset of CPUs.
For a provider ticket, keep a protected evidence directory and capture related signals in the same UTC window:
CPU_EVIDENCE_DIR="./cpu-evidence-$(date -u +%Y%m%dT%H%M%SZ)"
install -d -m 700 "$CPU_EVIDENCE_DIR"
date -u | tee "$CPU_EVIDENCE_DIR/context.txt"
uptime | tee -a "$CPU_EVIDENCE_DIR/context.txt"
lscpu | tee "$CPU_EVIDENCE_DIR/lscpu.txt"
LC_ALL=C mpstat -P ALL 5 60 | tee "$CPU_EVIDENCE_DIR/mpstat.txt" &
MPSTAT_CAPTURE_PID=$!
LC_ALL=C vmstat 5 60 | tee "$CPU_EVIDENCE_DIR/vmstat.txt" &
VMSTAT_CAPTURE_PID=$!
wait "$MPSTAT_CAPTURE_PID" "$VMSTAT_CAPTURE_PID"
The two samplers run together, so their five-minute windows can be compared. Review files before sharing them. Hardware and hostname details may be operationally sensitive, and application URLs or customer identifiers do not belong in a public paste. Send the provider only the evidence needed for the case.
Correlate Steal with Real Workload Impact
Infrastructure data becomes persuasive when it lines up with user impact. During the same sample window, record one safe application measurement: response time for a read-only health endpoint, job duration, request p95 latency, queue age or a database query already approved for monitoring.
| Evidence pattern | Interpretation | Action |
|---|---|---|
Latency rises with %usr; %steal stays near baseline |
Guest demand is the stronger explanation | Profile and tune before blaming the host |
Latency rises with sustained %steal; guest CPU demand is modest |
Host scheduling contention is plausible | Repeat the window and prepare escalation evidence |
%steal rises but latency and throughput remain normal |
Capacity risk exists without demonstrated impact | Monitor; avoid an emergency migration |
Latency rises with %iowait, disk queue or database waits |
The bottleneck is probably not CPU scheduling | Investigate storage and query behavior |
| All CPU fields look calm but a burstable balance is exhausted | Provider policy may be limiting CPU | Check plan-specific metrics and terms |
There is no universal percentage that proves failure for every workload. A latency-sensitive API can notice short interruptions that a nightly batch barely feels. Establish the server’s normal range, look for repeated multi-sample deviation, and correlate it with the business symptom. A single colorful number is weaker than a modest but repeatable pattern.
Separate Steal Time from CPU Credits and Quotas
Shared-host contention, burst credits and guest quotas can all feel like “the VPS is not getting CPU,” but they are not the same mechanism.
Bursty cloud plans may earn and spend CPU credits. AWS, for example, provides separate CPU credit monitoring for burstable instances. A depleted balance or baseline cap must be checked in the provider control plane; it should not be inferred from %steal alone.
Containers and systemd services can also have CPU quotas inside the guest. Inspect the workload’s cgroup or container limits when one service is slow but the rest of the VPS is healthy. Likewise, a process with one busy thread can saturate a single vCPU while the aggregate appears comfortable.
Zero steal does not conclusively clear every virtualization platform. Red Hat documents steal as CPU time the guest needed but the host did not provide, while a separate Red Hat support note describes VMware guests that may still report zero under overcommit. Use steal when the platform exposes it, but never make it your only performance signal.
Turn Sampling into Monitoring
If the problem appears only at certain hours, an interactive terminal will miss it. Enable normal sysstat collection according to the distribution’s documentation or use an existing host-metrics agent. Do not deploy a second monitoring stack during an active incident unless it is already part of the recovery plan.
Prometheus Node Exporter exposes CPU seconds by mode on Linux. A practical five-minute view is:
100 * avg by (instance) (
  rate(node_cpu_seconds_total{mode="steal"}[5m])
)
Alerting should require duration and context. A condition that persists across several evaluation windows is more useful than one instant. Pair it with application latency or queue depth, and annotate deployments so an internal release is not mistaken for a host event.
Retain enough history to compare busy and quiet periods. Also preserve the provider plan name, region, VM size and incident UTC window; those details make an escalation actionable without exposing credentials or customer data.
Choose the Smallest Justified Response
| Finding | First response | Escalate when |
|---|---|---|
| Guest application saturates its vCPUs | Profile, reduce work, add caching or resize | Demand remains legitimate after tuning |
| Burstable credits are exhausted | Change workload timing or choose a non-burstable plan | The baseline cannot support normal traffic |
| Repeated steal correlates with latency | Open a provider case with UTC samples and impact | The pattern persists or recurs after provider action |
| One VM or region repeatedly shows contention | Test a controlled migration or replacement instance | Equivalent workloads differ materially |
| Predictable CPU isolation is a hard requirement | Evaluate dedicated capacity | Shared scheduling risk is unacceptable by design |
Do not run an uncontrolled benchmark on a busy production server to “prove” the host is bad. It can harm users and confound the evidence with your own artificial demand. If a comparison is necessary, replay an approved workload on a staging or replacement instance with the same software, dataset shape and observation window.
A migration also needs rollback. Capture configuration and data backups, lower DNS TTL only when the migration plan calls for it, validate the replacement privately, compare results, and keep the original server recoverable until data consistency and application health pass.
For root-managed workloads, a performance-aware VPS plan should be chosen around sustained demand, not only peak benchmark numbers. If the team does not own Linux sampling, alerts and incident response, a managed hosting service may be a better operational fit.
Build a Provider-Ready Evidence Package
A useful ticket is short and reproducible:
- State the server identifier privately, plan and region.
- Give the exact UTC start and end of two or more affected windows.
- Attach
mpstator equivalent time-series output, not one screenshot. - Describe the application symptom and its baseline in neutral terms.
- Note guest CPU, iowait, memory pressure, deployments and credit status.
- Ask whether the host observed scheduling pressure, migration or a plan limit.
Avoid claiming that a named neighbor caused the event. The guest cannot see that identity. Ask the provider to compare the host-side scheduler with your timestamps, and keep the ticket focused on measurable service behavior.
When This Workflow Fits and When It Does Not
| This workflow fits | Use another investigation when |
|---|---|
A Linux VM exposes %steal and the slowdown is repeatable |
A bare-metal server has no hypervisor scheduling layer |
| Application latency may differ from guest CPU graphs | Storage, memory or network errors already explain the symptom |
| You need evidence before changing provider or plan | The provider has confirmed an outage and supplied a recovery path |
| A shared-vCPU plan handles production work | Dedicated CPU isolation is already guaranteed and measured differently |
Steal-time analysis is a virtualization performance workflow, which is why it belongs in Linux and VPS operations. It does not replace application profiling, disk monitoring, network tests or provider-side telemetry.
Recommended Next Step
Choose one real slow window and collect five minutes of per-vCPU mpstat, guest process demand and application latency in UTC. Repeat during a healthy window. If steal rises repeatedly only with the slowdown, preserve the two comparisons and open a provider case before making a larger infrastructure change.
FAQ
What is CPU steal time on a VPS?
It is time when a virtual CPU was ready to run but waited while the hypervisor serviced another virtual processor. Linux reports it as %steal or st.
Does high steal time prove a noisy neighbor?
No. It supports a host-scheduling contention hypothesis, but the guest cannot identify a specific neighbor or every provider policy. Repeated samples and application impact make the case stronger.
What CPU steal percentage is bad?
There is no universal threshold. Compare the VPS with its healthy baseline and look for a sustained rise that correlates with latency, throughput loss or queue growth.
Why does top show zero steal time?
The host may be uncongested, the sample may be too short, or the virtualization platform may not expose steal accurately. Use repeated mpstat samples plus provider and application metrics.
Is CPU steal the same as iowait?
No. Steal is involuntary vCPU wait at the hypervisor layer. Iowait relates to idle CPU time while the guest has an outstanding I/O request.
Should I upgrade the VPS when steal time rises?
Not from one spike. First rule out guest saturation, credits and quotas. If repeated steal tracks real impact, ask the provider to investigate and compare resizing, migration or dedicated capacity.