Lifetime VPS Europe
 Lifetime VPS Asia
 Lifetime WooCommerce Hosting
 Lifetime Hosting
 Lifetime Game Dedicated Servers
 Chicago, US
 Tokyo, Japan
 Singapore
 Hong Kong
 Seoul, South Korea
 Amsterdem, Netherlands
 London, UK
 Stockholm, Sweden
 Oslo, Norway
 Vienna, Austria
 Zurich, Switzerland
 Sydney, Australia
 Wordpress Hosting
 VPS Hosting
 DDOS Protection
 Submit Ticket
 Full Management
 Guides
 Videos and Podcasts
 Discover Creative Ideas
 Voxfor Autonomous AI Workers
 Voxfor Mega Menu
 Voxfor Advanced Price Management For WooCommerce
 Voxfor Secure Live Chat and AI Support
 Voxfor Multilanguage
 Voxfor AI Content Summary
 Voxfor Autopilot
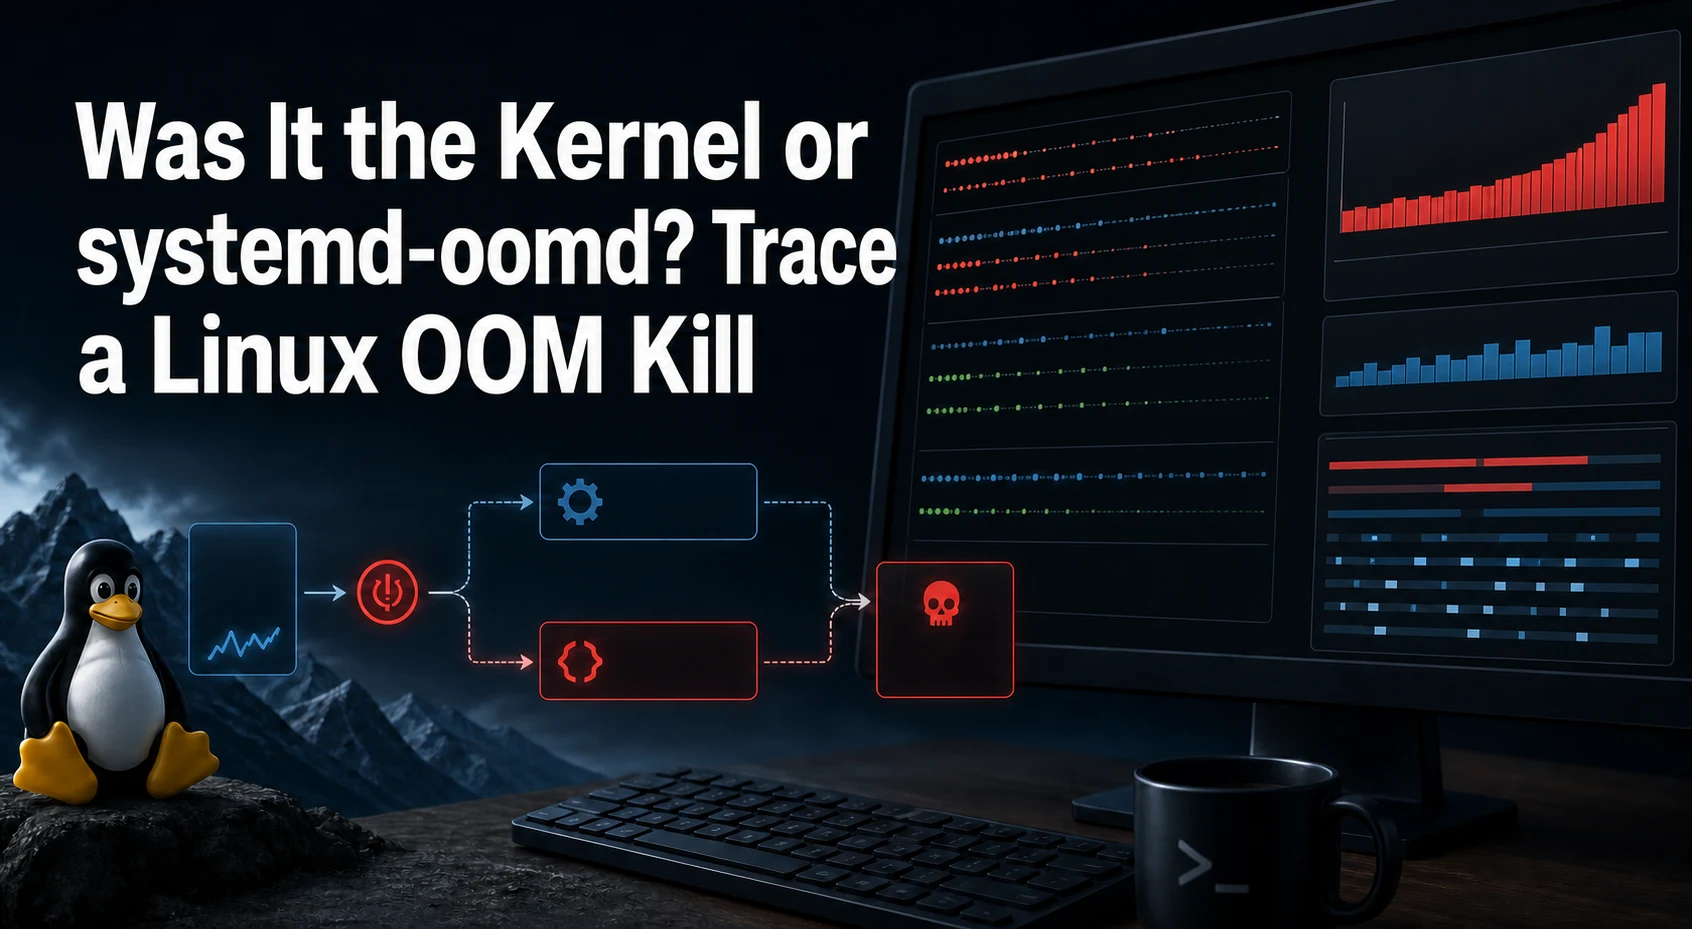
Two services can end with the same SIGKILL, yet require opposite repairs. A global kernel OOM event means the host could not satisfy an allocation. A cgroup-local OOM means one unit reached its own hard boundary, even if the host still had memory. systemd-oomd is different again: it can kill a selected cgroup after sustained memory pressure before the kernel reaches global exhaustion.
Do not begin by clearing caches, changing oom_score_adj, or ordering more RAM. First identify who issued the kill and which memory boundary was under pressure. Kernel logs, cgroup v2 counters, the service result, and the systemd-oomd journal form a short evidence chain. Once the actor and scope agree, the repair becomes smaller and safer.
This guide targets modern Linux systems using systemd and cgroup v2. Commands are read-only unless a later section explicitly creates a service override. Preserve output before restarting the unit because a destroyed cgroup can take its most useful counters with it.
Identify the actor before you restart the victim
Start with an incident window in UTC and the exact unit name. An application log that simply stops is not enough: SIGKILL cannot be caught, so the process may never write a final message. A shell reporting Killed is also ambiguous. It records the outcome observed by the parent, not the subsystem that selected the victim.
Capture the kernel journal, unit result, cgroup path, and userspace OOM journal while the evidence is still present:
unit=example.service
sudo journalctl -k --since '-20 minutes' --no-pager | grep -Ei 'oom|out of memory|killed process'
sudo systemctl show "$unit" -p Result -p ExecMainCode -p ExecMainStatus -p ControlGroup -p MemoryCurrent -p MemoryHigh -p MemoryMax
sudo journalctl -u systemd-oomd --since '-20 minutes' --no-pager
Treat the three outputs as independent witnesses. Kernel lines containing oom-kill and Killed process identify kernel action. A unit result of oom-kill confirms that systemd classified the service death as OOM-related, but it does not by itself prove global exhaustion or identify systemd-oomd. Userspace action should appear in systemd-oomd‘s own journal with the selected cgroup.
If the service is still stopped, do not erase the failed state yet. systemctl reset-failed changes management state and can obscure the sequence without repairing memory pressure. When repeated OOM exits have also triggered systemd’s restart brake, preserve the memory evidence first, then use the systemd restart-limit workflow.
Read three evidence frames, not one memory snapshot
free -h taken after a victim died often looks reassuring because the kill already released memory. The useful question is not “how much memory is free now?” It is “which boundary was exhausted or stalled immediately before the kill?” Three evidence frames answer that question.
Kernel OOM leaves an allocation-failure record
Search the kernel journal around the incident, not only for the final victim line. A kernel OOM report can include the allocation context, constraint, memory cgroup, task list, oom_score_adj, and selected process. The exact format varies by kernel, so avoid parsers that depend on one line number or column order.
sudo journalctl -k --since '2026-08-03 01:00:00 UTC' --until '2026-08-03 01:10:00 UTC' --no-pagerLook for a pair of facts: an OOM invocation and a later Killed process record. A constraint or memcg reference can reveal that the kernel acted inside a limited cgroup rather than across the whole host. The process with the largest RSS is not automatically the guilty workload; victim selection considers badness scoring and protection adjustments, while the allocation that exposed the shortage may have come from another task.
Keep the full block in the incident record. Copying only the victim name discards whether the event was global, NUMA-constrained, cpuset-constrained, or memory-cgroup constrained. Those distinctions change the response.
cgroup v2 counters expose a local hard boundary
On a systemd host, each service normally lives in a cgroup. Read its ControlGroup property and then inspect the corresponding directory under /sys/fs/cgroup before stopping or recreating the unit:
unit=example.service
cg=$(systemctl show "$unit" -p ControlGroup --value)
sudo sh -c "echo '--- memory.current' && cat '/sys/fs/cgroup${cg}/memory.current' && echo '--- memory.high' && cat '/sys/fs/cgroup${cg}/memory.high' && echo '--- memory.max' && cat '/sys/fs/cgroup${cg}/memory.max' && echo '--- memory.events' && cat '/sys/fs/cgroup${cg}/memory.events'"
The current Linux cgroup v2 documentation defines the decisive counters. high records throttling at memory.high; max records attempts to cross memory.max; oom records OOM conditions; and oom_kill counts processes killed by an OOM killer. memory.events is hierarchical, while memory.events.local limits the view to the cgroup itself when that file is available.
A nonzero oom_kill beside a finite memory.max supports a local memory-budget incident, even when MemAvailable on the host never reached zero. Compare the unit, its parent slice, and siblings if hierarchy matters. One noisy child can create pressure seen at a parent, and a parent limit can constrain several otherwise healthy services.
systemd-oomd records a PSI-driven userspace decision
systemd-oomd uses cgroup v2 and Pressure Stall Information (PSI) to act on configured units before the kernel’s last-resort global OOM path. Its journal should identify the selected cgroup. oomctl shows monitored contexts and candidates on versions that provide the command:
sudo systemctl is-active systemd-oomd
sudo journalctl -u systemd-oomd --since '-20 minutes' --no-pager
sudo oomctl --no-pager
The current systemd-oomd manual describes a userspace service that evaluates cgroups with PSI and kills the chosen cgroup with SIGKILL. Because it acts on policy and sustained stalls, the host may still show allocatable memory after the selected workload disappears. Its documentation also strongly recommends swap: swap gives pressure detection time to observe contention, although swap does not guarantee that a workload fits.
Absence matters too. If systemd-oomd is inactive and its journal has no decision in the incident window, do not blame it because a distribution happens to ship the binary. Conversely, a userspace kill record should not be relabeled as kernel global OOM merely because the unit result says oom-kill.
Reconstruct the pressure window in reverse
After ownership, rebuild the minutes before the kill. Begin at the death timestamp and move backward through PSI, cgroup events, service metrics, traffic, jobs, deploys, and host capacity. Reverse reconstruction prevents a post-restart “healthy” snapshot from replacing the incident.
Pressure shows lost work before memory reaches zero
Linux PSI reports time tasks spent stalled on CPU, memory, or I/O. For memory, some means at least one task was stalled; full means all non-idle tasks were stalled simultaneously. The kernel PSI documentation explains the rolling averages and cumulative total.
cat /proc/pressure/memory
systemctl show example.service -p MemoryCurrent -p MemoryHigh -p MemoryMax -p TasksCurrent
One reading after the incident is not a timeline. Use monitoring data when available, or begin collecting PSI and cgroup counters at a suitable interval after recovery. Correlate elevated some/full pressure with application latency, queue depth, request failures, database waits, and swap activity. Memory utilization alone cannot show how much useful work was stalled.
For a local unit, memory.pressure inside its cgroup provides scoped PSI. That file is useful when host-level pressure stayed moderate but one service or slice experienced sustained reclaim stalls. Record the cgroup path with the sample; a number without scope is difficult to interpret later.
Workload evidence separates a leak from a legitimate peak
A steady climb after every request points toward retention or a leak. A sharp bounded spike may belong to an import, backup, compiler, image transform, cache warm-up, or query. Repeated peaks at the same business event are capacity evidence, not random noise. A deploy timestamp can identify a regression, but only when the memory curve changed with it.
Capture enough workload context to explain the shape:
- resident memory and allocation metrics from the application or runtime;
- request rate, concurrency, queue depth, worker count, batch size, and job identity;
- database buffer/cache settings and connection counts where relevant;
- container or service limits inherited from the parent slice;
- swap-in/swap-out,
MemAvailable, and PSI over the same interval; - the last known release, configuration change, and rollback point.
Avoid the shortcut “Linux used all RAM.” Linux normally uses spare memory for reclaimable cache. The incident question is whether reclaim, swap, throttling, or a hard boundary could not satisfy the workload in time. Clearing caches can make a dashboard look different while removing useful warm data and leaving the real growth pattern unchanged.
Repair the boundary that actually failed
Choose one branch from the evidence. Mixing a RAM resize, swap change, service limit increase, worker reduction, and OOM-score adjustment in one release makes it impossible to know what restored stability.
Global kernel exhaustion needs host-wide headroom
When the kernel report proves global OOM and monitoring shows host-wide pressure, reduce or reschedule the largest avoidable peak, correct a leak, lower concurrency, or add measured capacity. Swap can absorb a short anonymous-memory spike and provide time for pressure-based action, but heavy swap may create unacceptable latency. Size from the workload’s measured peak plus operating headroom, not a universal RAM-to-swap ratio.
Capacity decisions should include recovery objectives and the full resident workload. When the evidence shows that the host is consistently undersized, add measured capacity only after preserving the workload curve and defining an acceptance test. More RAM does not prove that the previous configuration defect disappeared.
Do not protect every daemon with negative OOMScoreAdjust. Protection moves victim selection toward another process and can sacrifice SSH, monitoring, or the database that keeps the service recoverable. Reserve strong protection for a genuinely critical control-plane process after testing the consequence for every other workload.
A cgroup-local OOM needs a corrected service envelope
If memory.events and kernel scope show a service crossing memory.max, determine whether the limit is wrong or the workload exceeded its contract. Raising the cap can be correct when measured normal peaks no longer fit. Keeping the cap and reducing concurrency is better when one service must not consume the host.
For systemd units, the current resource-control manual treats MemoryHigh= as the main throttling mechanism and MemoryMax= as the last line of defense. Create a drop-in only after choosing values from observed peaks and host headroom:
# sudo systemctl edit example.service
[Service]
MemoryHigh=2G
MemoryMax=2500M
OOMPolicy=stop
Those numbers are examples, not recommendations. MemoryHigh= lets the kernel reclaim and throttle before the hard edge; MemoryMax= still permits an OOM inside the cgroup when the workload cannot stay below it. OOMPolicy=stop controls how systemd reacts after an OOM kill in the unit. It does not prevent the kill and does not create capacity.
Before applying a drop-in, save the current effective values. After editing, run systemd-analyze verify where appropriate, reload the manager, restart only during the approved window, and keep an exact rollback: remove the new drop-in, run daemon-reload, and restore the prior unit behavior.
A systemd-oomd kill needs policy and pressure review
When the userspace journal proves systemd-oomd selected the cgroup, inspect the monitored ancestor, pressure limit, duration, swap policy, and candidate set. A service may be the largest eligible pressure source without being the origin of every allocation. Review sibling workloads and parent slices before exempting it.
ManagedOOM controls belong in a deliberate slice design. Disabling systemd-oomd globally can trade a controlled cgroup kill for prolonged stalls or a later kernel OOM. Raising the pressure limit blindly can make the service appear more tolerant while increasing latency for every tenant on the host. Change the smallest policy boundary, retain another guard such as MemoryHigh=, and compare PSI plus workload behavior during the next representative peak.
Convert one incident into a measurable memory envelope
A stable service needs both a capacity budget and an acceptance boundary. Record normal resident memory, expected burst, MemoryHigh, MemoryMax, swap allowance, worker/concurrency settings, parent-slice limit, and the business event that creates the peak. Add owner, review date, and rollback path so the values do not become unexplained folklore.
Monitoring should combine:
- host
MemAvailable, swap activity, and/proc/pressure/memory; - unit
MemoryCurrentplusmemory.eventscounters; systemd-oomddecisions and kernel OOM signatures;- service restart count and
Resulttransitions; - workload latency, errors, queue depth, and completed work.
Alert on change and duration, not one arbitrary percentage. A rising memory.events high counter with sustained PSI is actionable before oom_kill increments. A flat memory curve with one legitimate batch spike calls for a different threshold than a daemon that grows every hour.
Security and availability also shape the envelope. Preserve enough headroom for SSH, monitoring, logging, and the process that performs recovery. A database, web service, and batch worker sharing one unrestricted slice can convert one burst into a whole-host incident. Separate ownership where it creates a useful failure boundary, without inventing dozens of tiny limits that no one monitors.
Validate recovery without manufacturing a production outage
Release one correction in a controlled window. Do not run a fork bomb, allocate memory until the host swaps uncontrollably, or use a production OOM trigger to “prove” the alert. Reproduce the representative job in staging or inside a bounded disposable cgroup with console access and an explicit stop condition.
During the real workload peak, capture the same evidence set used in diagnosis:
watch -n 5 'cat /proc/pressure/memory; systemctl show example.service -p ActiveState -p Result -p MemoryCurrent -p MemoryHigh -p MemoryMax'Acceptance requires more than a running PID. Confirm that PSI returns to the normal band, oom_kill does not increment, latency and queue depth remain inside the service objective, and the expected work completes. Verify logs and monitoring from outside the process. If the change raised a limit, confirm that host headroom still protects recovery services.
Rollback when pressure or latency worsens, the service crosses the new envelope, or another workload loses its headroom. Keep the failed measurement; it explains why the old setting returned and which hypothesis should be tested next.
FAQ
How can I tell whether the Linux kernel OOM killer acted?
The Linux kernel OOM killer leaves kernel-journal evidence such as an OOM invocation and Killed process, often with constraint or memory-cgroup context. Capture the full event block with journalctl -k; a service’s SIGKILL or Result=oom-kill alone does not prove global kernel exhaustion.
How is systemd-oomd different from the kernel OOM killer?
systemd-oomd is a userspace service that uses cgroup v2 and PSI to act on configured cgroups during sustained memory pressure, potentially before kernel global OOM. Its own journal and oomctl identify the monitored context and selected cgroup.
Can a service be OOM-killed while the VPS still has free memory?
Yes. A service can reach a finite cgroup memory.max and experience local OOM while the host still has allocatable memory. Read the unit’s cgroup path, memory.events, memory.current, and memory.max before restarting it.
Does systemd Result=oom-kill identify who killed the process?
No. Result=oom-kill tells you systemd classified the unit failure as OOM-related; it does not by itself distinguish global kernel OOM, memory-cgroup OOM, or systemd-oomd action. Correlate it with kernel and userspace journals.
Should I set OOMScoreAdjust=-1000 for an important service?
Usually not as a first repair. OOMScoreAdjust=-1000 strongly protects a process from kernel victim selection and can shift damage to SSH, monitoring, databases, or other workloads. Use strong protection only for a proven critical control-plane role with tested failure consequences.
Will adding swap prevent future OOM kills?
Swap can add runway and improve pressure detection for short anonymous-memory spikes, but it does not guarantee prevention or make an oversized workload fit. Validate swap latency, PSI, the service budget, and host headroom together.
Which signals should I monitor after an OOM incident?
Monitor host memory PSI, MemAvailable, swap activity, unit MemoryCurrent, cgroup memory.events, kernel OOM messages, systemd-oomd decisions, service restarts, latency, errors, and completed work. The combination distinguishes pressure from actual workload failure.
Is it safe to trigger OOM on production to test monitoring?
No. Exhausting production memory can kill unrelated processes, stall recovery access, and corrupt in-flight work. Test alerts in staging or a bounded disposable cgroup with console access, then validate the production correction during a representative but controlled workload peak.
Close with a memory envelope, not “added RAM”
An OOM incident is closed when the evidence names the actor and scope, the correction matches that owner, and a representative workload completes without renewed pressure or collateral failure. Attach the kernel block, cgroup counters, PSI window, systemd-oomd record, effective unit settings, workload result, and rollback decision to the incident.
Keep this record specific to the memory domain: the deciding mechanism, constrained cgroup, workload behavior and proof that the original pressure no longer returns.