Lifetime VPS Europe
 Lifetime VPS Asia
 Lifetime WooCommerce Hosting
 Lifetime Hosting
 Lifetime Game Dedicated Servers
 Chicago, US
 Tokyo, Japan
 Singapore
 Hong Kong
 Seoul, South Korea
 Amsterdem, Netherlands
 London, UK
 Stockholm, Sweden
 Oslo, Norway
 Vienna, Austria
 Zurich, Switzerland
 Sydney, Australia
 Wordpress Hosting
 VPS Hosting
 DDOS Protection
 Submit Ticket
 Full Management
 Guides
 Videos and Podcasts
 Discover Creative Ideas
 Voxfor Autonomous AI Workers
 Voxfor Mega Menu
 Voxfor Advanced Price Management For WooCommerce
 Voxfor Secure Live Chat and AI Support
 Voxfor Multilanguage
 Voxfor AI Content Summary
 Voxfor Autopilot
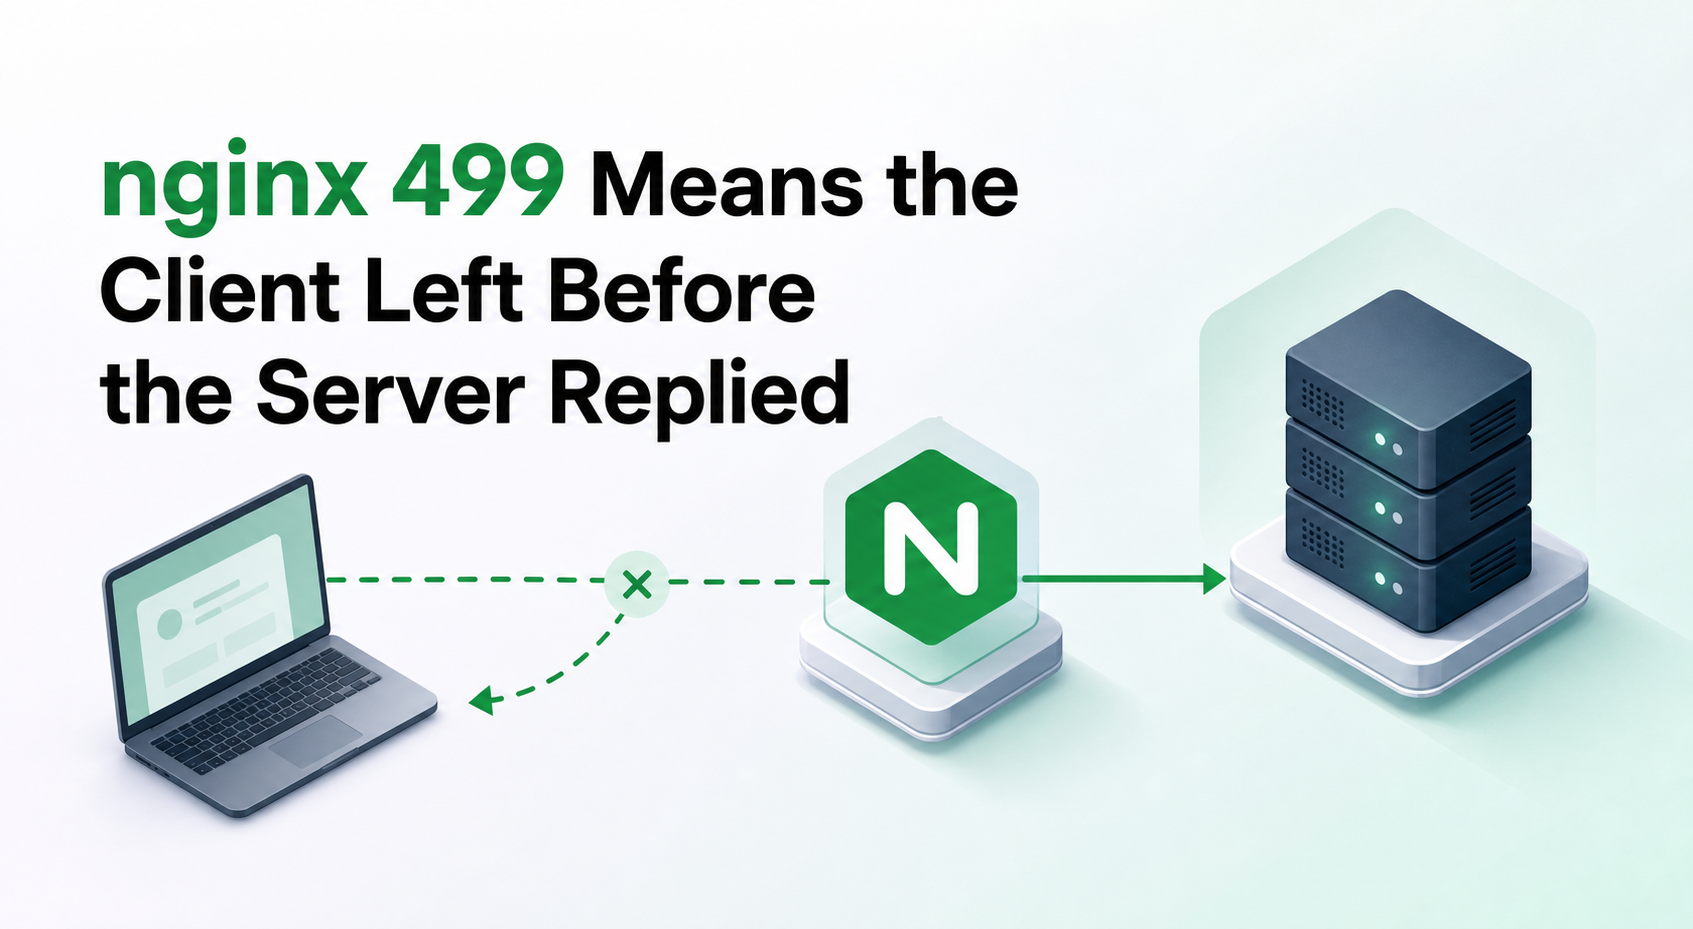
An nginx access log records status 499 when the downstream client closes its connection before nginx can finish the response. The number tells you who stopped waiting from nginx’s point of view; it does not yet tell you why they left or which component was slow.
That distinction prevents a common incident mistake. Raising every timeout may reduce the visible 499 count while users still wait too long, an edge proxy becomes the next component to give up, or abandoned write requests keep running after clients retry. A useful diagnosis starts with the logging hop and two clocks: total request time and upstream time.
Start with the hop that wrote 499
client is a relative role. On a simple VPS, it may be a browser or mobile app connected directly to nginx. Behind a CDN, load balancer, API gateway or another reverse proxy, that intermediary is nginx’s client even when a human initiated the original request.
Cloudflare’s current 499 documentation describes the same boundary: the client terminates before the server responds, so the server cannot send its intended status. Occasional cancellations are expected because users navigate away, clients enforce deadlines, probes disconnect, and networks fail. A 499 is therefore a log receipt, not proof of an nginx fault or an origin timeout.
Draw the real path before changing configuration:
browser or SDK -> CDN/LB -> nginx -> application -> database/APIFor each arrow, name the caller, receiver and timeout owner. A 499 in origin nginx means the CDN or load balancer left. A 499 in an ingress controller may mean an external load balancer left. A browser-side cancellation may never reach a downstream origin log if an earlier edge already ended the work. By contrast, a completed WordPress gateway-timeout investigation starts with a proxy that stayed connected long enough to issue 504. Those receipts are not interchangeable.
Give the access log enough clocks
The default combined log cannot separate connection delay from response delay. nginx’s log module defines $request_time as elapsed time from the first client bytes to the log write. Upstream variables add the address, connection time, time to response headers, full response time and upstream status.
Add a temporary or permanent structured format at http scope, then attach it only to the relevant virtual host or location. Review the destination and retention policy because request URIs, user agents and forwarded identities may contain sensitive data.
log_format timing escape=json
  '{"time":"$time_iso8601","request_id":"$request_id",'
  '"host":"$host","method":"$request_method","uri":"$uri",'
  '"status":$status,"bytes":$body_bytes_sent,"request_time":$request_time,'
  '"upstream_addr":"$upstream_addr","upstream_connect":"$upstream_connect_time",'
  '"upstream_header":"$upstream_header_time","upstream_response":"$upstream_response_time",'
  '"upstream_status":"$upstream_status","user_agent":"$http_user_agent"}';

access_log /var/log/nginx/timing.json timing;
Validate before reload, make one controlled request and inspect one line:
sudo nginx -t
sudo systemctl reload nginx
sudo tail -n 1 /var/log/nginx/timing.json
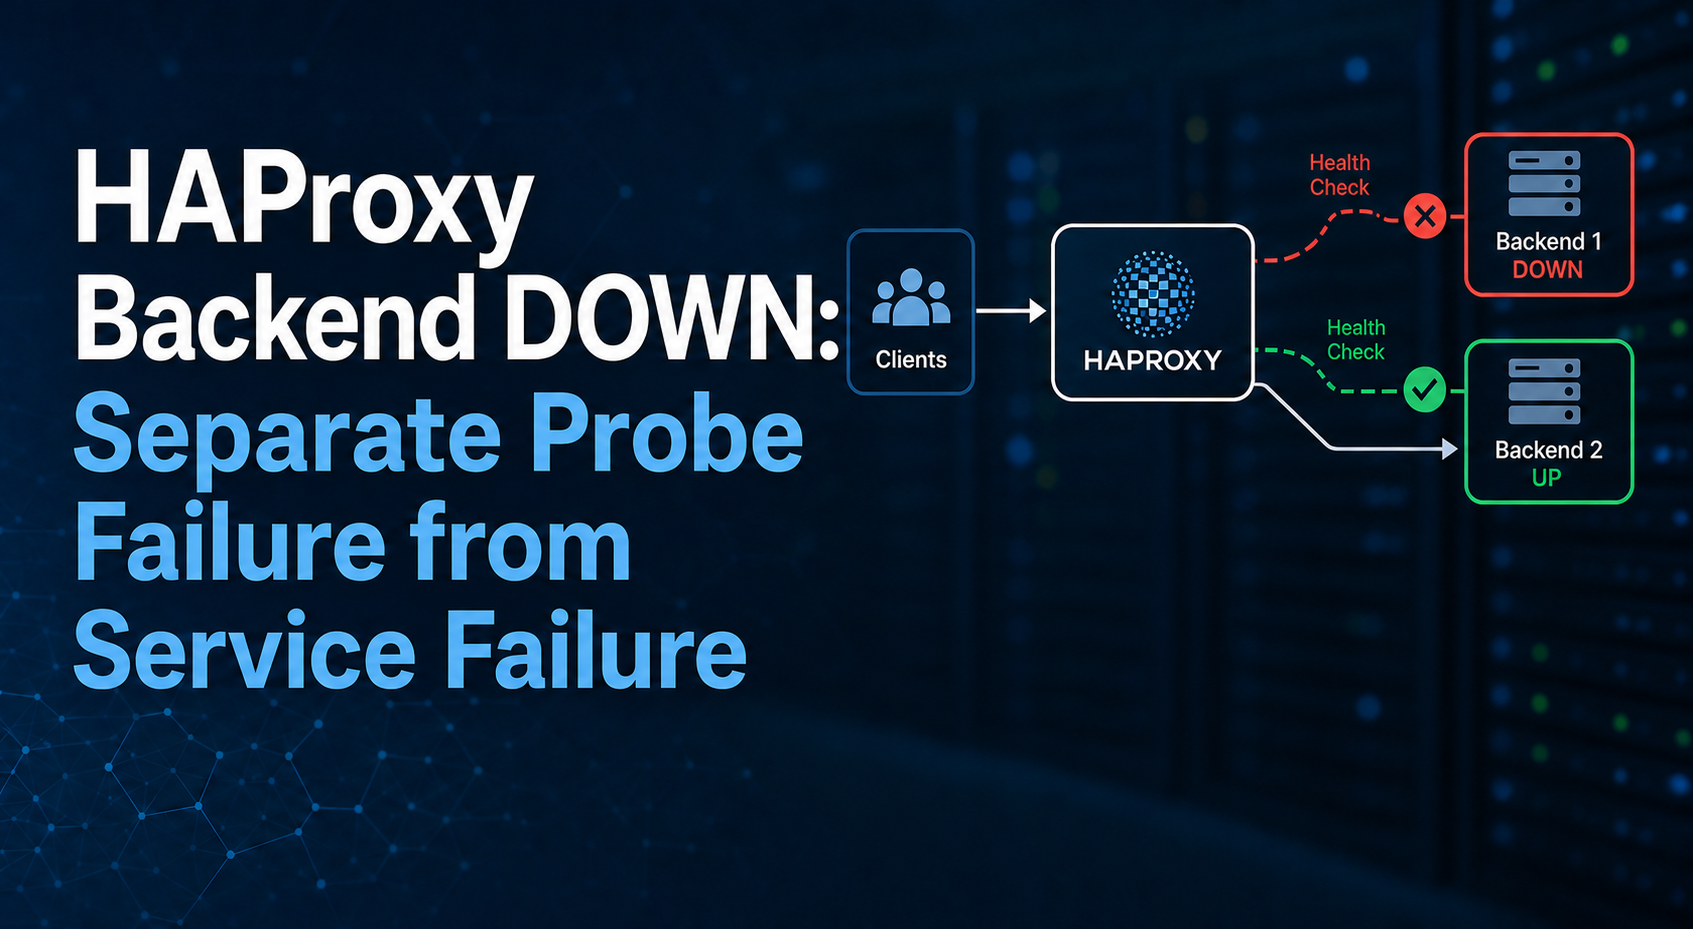
Ingress-NGINX documents a default format containing request time, upstream name/address, upstream response time/status and request ID. Keep the controller’s generated configuration model instead of pasting a standalone nginx file into Kubernetes. When an upstream is marked unavailable, continue with HAProxy probe-versus-service evidence as a separate health-contract problem rather than treating 499 as proof that the service was down.
Read timing shapes, not one global count
One field rarely owns the incident. Compare request and upstream values for the same route, client class and time window.
| Log shape | What the line proves | Next evidence |
|---|---|---|
| No upstream address or status | nginx did not record a completed upstream attempt | Request-body arrival, rewrite/access rules, client network and error log |
| Long connect time | Establishing the upstream connection consumed the budget | Listener backlog, DNS, routing, packet loss, TLS and upstream capacity |
| Fast connect, long header time | The upstream accepted but delayed its first response headers | Application queue, database wait, dependency call and worker occupancy |
| Header arrives, response time stays long | Streaming or response-body delivery continued until departure | Response size, buffering, downstream rate and application streaming behavior |
| Short request and upstream times | Client cancelled quickly or an automated actor disconnected | User action, SDK deadline, probe logic, bot pattern and adjacent-hop log |
| Comma-separated upstream values | More than one upstream attempt occurred | Retry order, per-attempt statuses and the component that exhausted its deadline |
A network problem becomes credible only when adjacent evidence agrees. Rising retransmits, interface errors or receive-path drops during the same window can justify Linux packet-drop diagnosis. A lone 499 line cannot distinguish transport loss from a user pressing Stop.
Percentiles also matter. Compare 499 rate and P50/P95/P99 request time by route, method and upstream; do not average fast static files with a slow report endpoint. A cluster just below a known 30-second client deadline says more than a daily total.
Correlate one request across every layer
Use a request ID that the trusted edge creates or validates, then forward it. Do not let an arbitrary public value become a privileged log or trace selector without length and character controls. nginx’s $request_id can provide a local identifier; application and edge conventions may use X-Request-ID or a trace context instead.
For one affected request, preserve:
- timestamp with timezone;
- method, normalized route and response bytes;
- request ID or trace ID;
- nginx request and upstream timings;
- upstream address and status sequence;
- edge/CDN outcome and client deadline;
- application span, worker wait and dependency duration.
Query a bounded window rather than copying entire logs into a ticket:
request_id='REPLACE_WITH_VALIDATED_ID'
sudo grep -F -- "$request_id" /var/log/nginx/timing.json
sudo journalctl -u app.service --since '10 minutes ago' --no-pager | grep -F -- "$request_id"
If the same ID shows nginx waiting 12 seconds while the application completed in 100 milliseconds, inspect network delivery, buffering and clock alignment. If application spans consume 11.8 seconds, nginx is reporting the delay rather than creating it. Missing correlation is itself a finding: add safe propagation before making a global timeout change.
Find why the downstream ran out of patience
Client departure usually belongs to one of four families.
Voluntary cancellation: a user navigated away, a search-as-you-type request was superseded, or a hedged request lost the race. Low-impact cancellations on explicitly cancellable routes may be normal.
Deadline mismatch: a browser SDK, CDN, load balancer or gateway has a shorter budget than the work behind nginx. Record configured and effective values at every hop. A round number in request time often exposes the owner, but prove it from configuration and adjacent logs.
Slow work: application queues, database locks, external APIs, CPU pressure or worker exhaustion delay the first byte. For WordPress/PHP workloads, PHP-FPM queue saturation evidence separates a full worker pool from generic advice to raise proxy_read_timeout.
Automated or hostile traffic: scanners, scrapers, health checks and attacks may open requests and leave early. Correlate route, source attribution, user agent, rate and protection-layer action. Voxfor DDoS protection services are relevant when edge telemetry shows abusive volume or origin exposure; a normal browser cancellation does not become an attack merely because nginx logged 499.
Uploads need separate treatment. If the client is still sending a large request body, inspect body-read timing, upload size, client bandwidth and intermediary limits. Upstream response time may be empty because nginx has not begun the proxied transaction. Do not “fix” that shape by extending an origin response timeout.
Change the responsible contract safely
Choose the smallest intervention that matches the evidence:
- reduce slow-route execution through indexing, queueing, caching or bounded work;
- align one intermediary deadline with an intentionally supported application duration;
- return an asynchronous job receipt for work that cannot finish inside an interactive deadline;
- stream periodic meaningful data only when the protocol and client support it;
- cancel upstream work when abandoned computation has no useful result;
- preserve important background work behind an idempotent job boundary.
nginx documents proxy timeout and abort behavior with proxy_read_timeout as the allowed interval between successive upstream reads, not a blanket limit for the entire response. Increasing it cannot repair a slow client, a saturated worker pool or a broken network path. It may simply keep resources occupied longer.
Likewise, proxy_ignore_client_abort on is not a generic 499 fix. It can keep a proxied request running after the downstream closes. That may be appropriate for a durable job submission, but it can be dangerous for payments, provisioning, email or other side effects if the client retries. Establish idempotency keys, transaction ownership and a result-retrieval path before deliberately continuing abandoned writes.
Rollback means restoring the previous scoped timeout or abort behavior, reloading only after nginx -t, and confirming the original route returns to its prior contract. Never restart nginx merely to clear a symptom without preserving the evidence window.
Prove recovery with a bounded replay
Replay a safe read-only or staging request from the same network position as the affected client. curl can expose connect, first-byte and total times:
curl --fail --silent --show-error --output /dev/null \
  --max-time 20 \
  --write-out 'code=%{http_code} connect=%{time_connect} start=%{time_starttransfer} total=%{time_total}\n' \
  'https://example.com/replace-with-safe-route'
One success is not acceptance. Observe representative concurrency through the normal client, edge and nginx path. Compare the same route and method before and after: request count, 499 rate, successful latency percentiles, upstream timing, error rate, worker/queue pressure and duplicated-effect indicators.
Close the change only when the intended client receives the intended result inside its deadline and the upstream no longer shows unexplained work after departure. A lower 499 count alone can mean the failure moved to 504, 522, a client exception or silent duplicate processing.
FAQ: Operator questions after a 499 spike
Is nginx 499 a real HTTP response sent to the client?
Usually no. nginx uses 499 in its logs after the downstream connection closes, so that departing client normally receives a cancellation, timeout or broken connection rather than a complete 499 response.
Does every nginx 499 mean the upstream application is slow?
No. Upstream slowness is one cause, but user cancellation, client deadlines, upload interruption, network loss, probes and bots can produce the same log status. Request and upstream timings identify which path deserves investigation.
Should I increase proxy_read_timeout to remove 499 errors?
Increase proxy_read_timeout only when evidence shows the current between-read budget is shorter than an intentionally supported upstream behavior and every earlier client or intermediary will wait longer. A broad increase can retain workers and connections without improving user latency.
Are occasional 499 entries normal?
Yes. Occasional client departures are expected on interactive websites and APIs. Escalate when rate, customer impact, route concentration, latency, abandoned work or duplicate effects cross a documented service boundary.
Why does a large upload show 499 without upstream timing?
The client may disconnect while nginx is still receiving the request body, before a proxied upstream attempt begins. Compare request length, body-read limits, client bandwidth, edge logs and nginx error context instead of changing origin response timeouts.
Can the application keep working after the client disconnects?
Yes, depending on proxy behavior, application server and execution stage. Treat non-idempotent work as a correctness risk: use durable job identity, bounded retries and a way to retrieve the original result before encouraging continued processing after disconnects.
Close the incident with two clocks
The final incident record should name the hop that logged 499, the downstream actor that left, total request time, upstream timing shape, correlated application outcome and the exact contract changed. Pair that causal receipt with a representative replay and a monitored window. Two clocks plus one shared request identity turn 499 from a vague client error into an owned, testable failure path.