Lifetime VPS Europe
 Lifetime VPS Asia
 Lifetime WooCommerce Hosting
 Lifetime Hosting
 Lifetime Game Dedicated Servers
 Chicago, US
 Tokyo, Japan
 Singapore
 Hong Kong
 Seoul, South Korea
 Amsterdem, Netherlands
 London, UK
 Stockholm, Sweden
 Oslo, Norway
 Vienna, Austria
 Zurich, Switzerland
 Sydney, Australia
 Wordpress Hosting
 VPS Hosting
 DDOS Protection
 Submit Ticket
 Full Management
 Guides
 Videos and Podcasts
 Discover Creative Ideas
 Voxfor Autonomous AI Workers
 Voxfor Mega Menu
 Voxfor Advanced Price Management For WooCommerce
 Voxfor Secure Live Chat and AI Support
 Voxfor Multilanguage
 Voxfor AI Content Summary
 Voxfor Autopilot
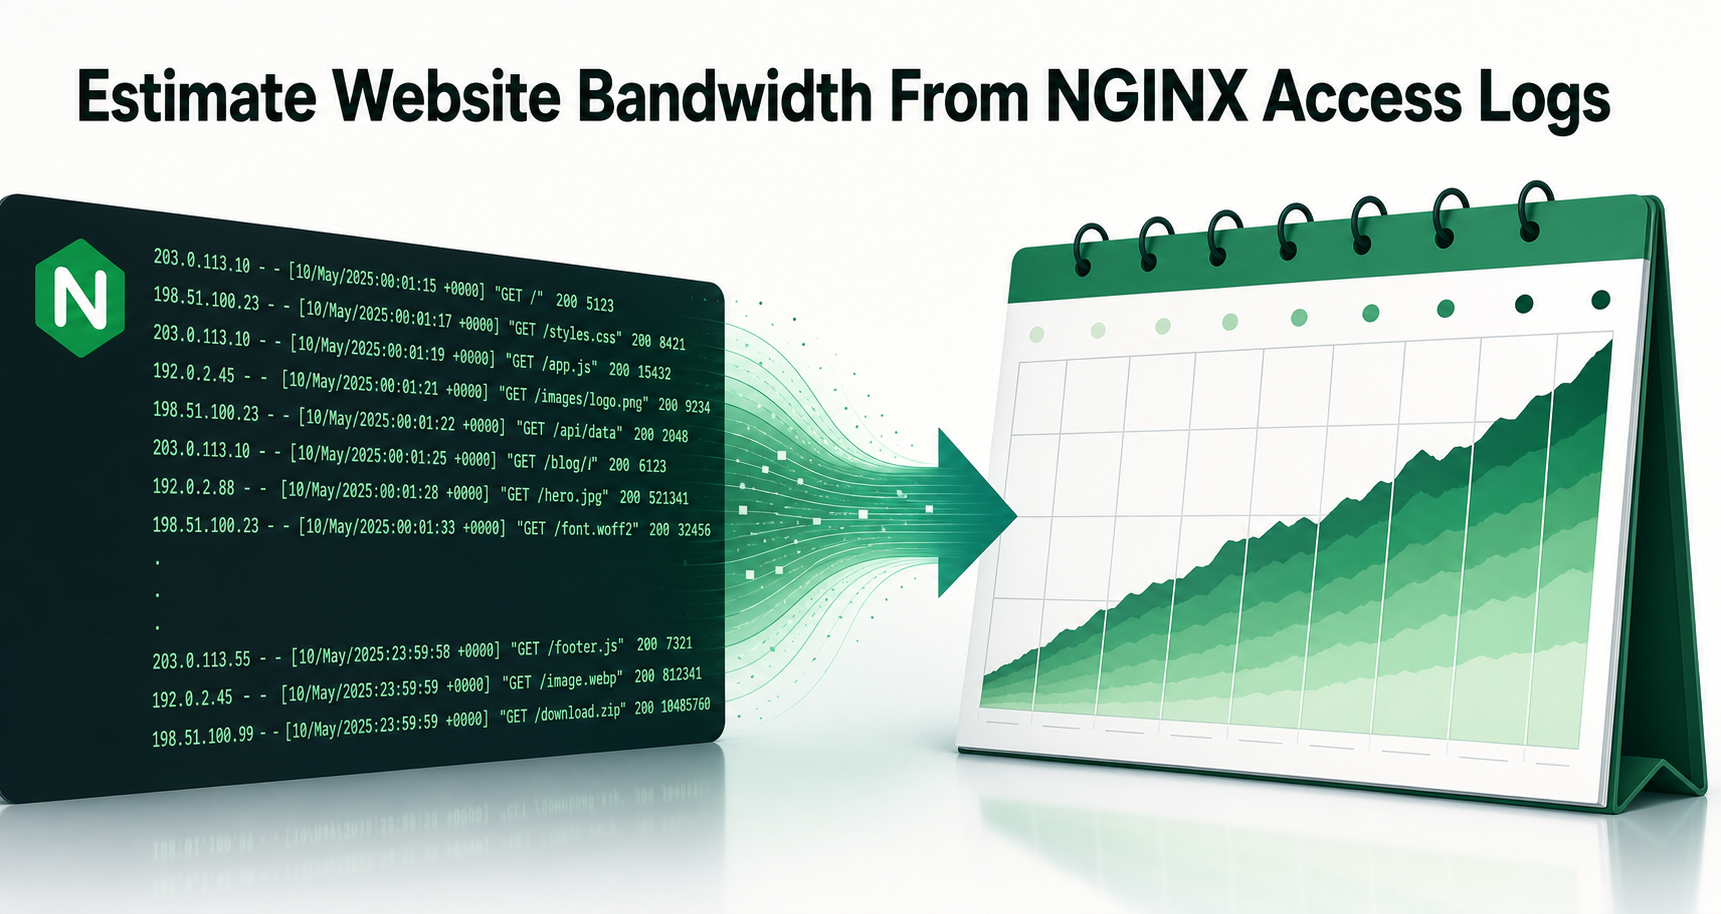
A hosting plan can quote gigabytes per month, terabytes per month, an uplink speed, or “unlimited” traffic. Those labels answer different questions. Before comparing plans, identify which meter the allowance follows and measure the same boundary on the website you already operate.
For an NGINX origin, the practical starting point is $bytes_sent: sum it over a complete representative window, inspect which workloads created the bytes, project the result with named assumptions, then compare it with separate CDN and provider receipts. Origin logs do not automatically equal visitor delivery or billable network transfer. They are one measured layer in the decision.
This workflow is for a small-business owner, agency decision maker, or hosting buyer who can obtain a secret-free NGINX log export and run reviewed commands. The reproduced lab used Debian 13, Bash 5.2, jq 1.7, and Python 3.13.5. Its 21-line dataset is an explicitly synthetic seven-day worked example under /tmp/voxfor-nginx-bandwidth-lab; substitute your export only after preserving the same date, schema, and path guards.
Which Bandwidth Number Are You Trying to Size?
In hosting language, monthly data transfer is a volume measured in bytes, GB, or TB. Throughput is a rate measured in bits per second, usually Mbps or Gbps. A site can transfer little data across a month yet briefly saturate a slow link during a launch. Another site can move many terabytes steadily without approaching its port speed.
That distinction is different from 95th-percentile commit billing, where sampled rates are sorted and the busiest tail is discarded. This article estimates monthly HTTP transfer from request records. It does not turn an average byte volume into a peak-rate guarantee.
Four evidence sources may disagree without any of them being broken:
| Evidence source | What it can count | What it cannot prove alone | Buyer use |
|---|---|---|---|
| NGINX origin access log | Responses and request lengths handled by that NGINX context | CDN cache hits, non-HTTP traffic, another virtual host, or provider accounting rules | Explain origin HTTP transfer and contributors |
| CDN edge report | Bytes served from edge to visitors and, on some products, origin fetches | Traffic bypassing the CDN or the hosting provider’s billable boundary | Separate visitor delivery from origin demand |
| Hosting/provider meter | Transfer the provider chooses to meter | Per-URL cause unless detailed logs are available | Decide whether an allowance or overage applies |
| Page-size formula | A planning estimate before history exists | Bots, caching, downloads, partial responses, APIs, retries, or actual request mix | Build an initial range, not a measured receipt |
PhoenixNAP and DCHost both show the familiar page-size × pageviews × visitors approach. It remains useful for a new site. Once real logs exist, replace guessed traffic mix with observed bytes while keeping growth and campaigns as explicit scenarios rather than pretending the last week is destiny.
Choose NGINX Fields That Match the Claim
NGINX’s current HTTP log-module documentation defines $bytes_sent as bytes sent to the client. The predefined combined format uses $body_bytes_sent, which excludes response headers. $request_length covers the request line, request headers, and request body received by NGINX.
For a hosting-transfer estimate, log at least a timestamp, virtual host, status, $bytes_sent, $body_bytes_sent, $request_length, and a workload label you can derive without storing private URLs. Prefer escape=json and validate the result as JSON rather than assuming whitespace field positions never change. DigitalOcean’s NGINX log guide provides broader configuration context; if the same record also needs latency ownership, structured 499 diagnosis shows where request and upstream timing fields belong.
Do not export cookies, authorization headers, full query strings, email addresses, or raw client IPs just to size transfer. Aggregate on the server where possible. When raw evidence must leave the host, restrict permissions, remove identifiers, state the UTC window, and record which virtual hosts and rotated files were included.
Build a Seven-Day Worked Ledger and Validate It
The first input refuses an existing path, creates an exact marker, and writes three representative records for each of seven UTC dates: normal pages, partial downloads, and protocol-only 304 responses. Values are synthetic so the workflow can be published without customer traffic or personal data.
set -Eeuo pipefail
LAB=/tmp/voxfor-nginx-bandwidth-lab
[[ ! -e "$LAB" ]]
install -d -m 700 "$LAB"
printf '%s\n' 'voxfor-nginx-bandwidth-lab-v1' > "$LAB/.marker"
cat > "$LAB/window.json" <<'JSON'
{"start_date":"2026-08-01","end_date":"2026-08-07","expected_days":7,"timezone":"UTC","hosts":["downloads.example.test","www.example.test"]}
JSON
cat > "$LAB/access.jsonl" <<'JSONL'
{"ts":"2026-08-01T09:00:00Z","host":"www.example.test","status":200,"bytes_sent":300000000,"body_bytes_sent":299999400,"request_length":620,"traffic_class":"page"}
{"ts":"2026-08-01T12:00:00Z","host":"downloads.example.test","status":206,"bytes_sent":80000000,"body_bytes_sent":79999400,"request_length":510,"traffic_class":"download"}
{"ts":"2026-08-01T18:00:00Z","host":"www.example.test","status":304,"bytes_sent":1000000,"body_bytes_sent":0,"request_length":480,"traffic_class":"protocol"}
{"ts":"2026-08-02T09:00:00Z","host":"www.example.test","status":200,"bytes_sent":340000000,"body_bytes_sent":339999400,"request_length":620,"traffic_class":"page"}
{"ts":"2026-08-02T12:00:00Z","host":"downloads.example.test","status":206,"bytes_sent":90000000,"body_bytes_sent":89999400,"request_length":510,"traffic_class":"download"}
{"ts":"2026-08-02T18:00:00Z","host":"www.example.test","status":304,"bytes_sent":1000000,"body_bytes_sent":0,"request_length":480,"traffic_class":"protocol"}
{"ts":"2026-08-03T09:00:00Z","host":"www.example.test","status":200,"bytes_sent":320000000,"body_bytes_sent":319999400,"request_length":620,"traffic_class":"page"}
{"ts":"2026-08-03T12:00:00Z","host":"downloads.example.test","status":206,"bytes_sent":100000000,"body_bytes_sent":99999400,"request_length":510,"traffic_class":"download"}
{"ts":"2026-08-03T18:00:00Z","host":"www.example.test","status":304,"bytes_sent":1000000,"body_bytes_sent":0,"request_length":480,"traffic_class":"protocol"}
{"ts":"2026-08-04T09:00:00Z","host":"www.example.test","status":200,"bytes_sent":370000000,"body_bytes_sent":369999400,"request_length":620,"traffic_class":"page"}
{"ts":"2026-08-04T12:00:00Z","host":"downloads.example.test","status":206,"bytes_sent":110000000,"body_bytes_sent":109999400,"request_length":510,"traffic_class":"download"}
{"ts":"2026-08-04T18:00:00Z","host":"www.example.test","status":304,"bytes_sent":1000000,"body_bytes_sent":0,"request_length":480,"traffic_class":"protocol"}
{"ts":"2026-08-05T09:00:00Z","host":"www.example.test","status":200,"bytes_sent":360000000,"body_bytes_sent":359999400,"request_length":620,"traffic_class":"page"}
{"ts":"2026-08-05T12:00:00Z","host":"downloads.example.test","status":206,"bytes_sent":120000000,"body_bytes_sent":119999400,"request_length":510,"traffic_class":"download"}
{"ts":"2026-08-05T18:00:00Z","host":"www.example.test","status":304,"bytes_sent":1000000,"body_bytes_sent":0,"request_length":480,"traffic_class":"protocol"}
{"ts":"2026-08-06T09:00:00Z","host":"www.example.test","status":200,"bytes_sent":440000000,"body_bytes_sent":439999400,"request_length":620,"traffic_class":"page"}
{"ts":"2026-08-06T12:00:00Z","host":"downloads.example.test","status":206,"bytes_sent":180000000,"body_bytes_sent":179999400,"request_length":510,"traffic_class":"download"}
{"ts":"2026-08-06T18:00:00Z","host":"www.example.test","status":304,"bytes_sent":1000000,"body_bytes_sent":0,"request_length":480,"traffic_class":"protocol"}
{"ts":"2026-08-07T09:00:00Z","host":"www.example.test","status":200,"bytes_sent":520000000,"body_bytes_sent":519999400,"request_length":620,"traffic_class":"page"}
{"ts":"2026-08-07T12:00:00Z","host":"downloads.example.test","status":206,"bytes_sent":220000000,"body_bytes_sent":219999400,"request_length":510,"traffic_class":"download"}
{"ts":"2026-08-07T18:00:00Z","host":"www.example.test","status":304,"bytes_sent":1000000,"body_bytes_sent":0,"request_length":480,"traffic_class":"protocol"}
JSONL
printf 'fixture=created records=%s\n' "$(wc -l < "$LAB/access.jsonl")"
Validation happens before arithmetic. This gate derives every expected UTC date from a declared start, end, and day count; the observed sequence must match it exactly. It also requires valid UTC timestamps, declared virtual hosts, known workload classes, numeric nonnegative fields, and body bytes no larger than total response bytes. A malformed, gapped, substituted, or partial export must fail instead of quietly becoming a confident forecast.
set -Eeuo pipefail
LAB=/tmp/voxfor-nginx-bandwidth-lab
[[ "$(<"$LAB/.marker")" == 'voxfor-nginx-bandwidth-lab-v1' ]]
[[ -f "$LAB/access.jsonl" && ! -L "$LAB/access.jsonl" ]]
[[ -f "$LAB/window.json" && ! -L "$LAB/window.json" ]]
python3 - "$LAB/window.json" "$LAB/access.jsonl" <<'PY'
import json, sys
from datetime import date, datetime, timedelta, timezone
manifest = json.load(open(sys.argv[1], encoding="utf-8"))
start = date.fromisoformat(manifest["start_date"])
end = date.fromisoformat(manifest["end_date"])
expected = [(start + timedelta(days=offset)).isoformat() for offset in range(manifest["expected_days"])]
assert manifest["timezone"] == "UTC"
assert expected[-1] == end.isoformat()
rows = [json.loads(line) for line in open(sys.argv[2], encoding="utf-8")]
assert rows
for row in rows:
    timestamp = datetime.fromisoformat(row["ts"].replace("Z", "+00:00"))
    assert timestamp.tzinfo == timezone.utc
    assert row["host"] in manifest["hosts"]
    assert isinstance(row["status"], int)
    for field in ("bytes_sent", "body_bytes_sent", "request_length"):
        assert isinstance(row[field], int) and row[field] >= 0
    assert row["body_bytes_sent"] <= row["bytes_sent"]
    assert row["traffic_class"] in {"page", "download", "protocol"}
observed = sorted({row["ts"][:10] for row in rows})
assert observed == expected
assert sorted({row["host"] for row in rows}) == sorted(manifest["hosts"])
print(f"schema=valid start={expected[0]} end={expected[-1]} days={len(expected)} records={len(rows)}")
PY
Seven days is only a demonstration boundary, not a universal minimum. For a steady site, use at least one complete normal week and compare several weeks. Ecommerce promotions, software releases, video, seasonal traffic, and monthly billing cycles may require 30-90 days plus separate event windows. Completeness matters more than an arbitrary duration.
Measure Daily Movement and the Workloads Behind It
Total first, then explain the contributors. The daily series reveals whether the chosen period is flat, rising, event-driven, or damaged by a missing file. Summing $bytes_sent provides the response-side origin total; request bytes remain separate because provider meters may count both directions.
set -Eeuo pipefail
LAB=/tmp/voxfor-nginx-bandwidth-lab
[[ "$(<"$LAB/.marker")" == 'voxfor-nginx-bandwidth-lab-v1' ]]
[[ -f "$LAB/access.jsonl" && ! -L "$LAB/access.jsonl" ]]
jq -rs '
  group_by(.ts[0:10])[] |
  [.[0].ts[0:10], (map(.bytes_sent) | add)] | @tsv
' "$LAB/access.jsonl" | awk -F '\t' '{printf "day=%s bytes=%s\n", $1, $2}'
jq -rs '
  "origin_total_bytes=\(map(.bytes_sent)|add) body_bytes=\(map(.body_bytes_sent)|add) request_bytes=\(map(.request_length)|add)"
' "$LAB/access.jsonl"
The worked week rises from 381,000,000 to 741,000,000 bytes. That shape should trigger a question before projection: is it ordinary growth, a planned campaign, a crawler, or a data-export problem? Group by a privacy-safe workload label and virtual host to find the decision owner.
set -Eeuo pipefail
LAB=/tmp/voxfor-nginx-bandwidth-lab
[[ "$(<"$LAB/.marker")" == 'voxfor-nginx-bandwidth-lab-v1' ]]
[[ -f "$LAB/access.jsonl" && ! -L "$LAB/access.jsonl" ]]
jq -rs '
  group_by(.traffic_class)[] |
  "class=\(.[0].traffic_class) bytes=\(map(.bytes_sent)|add) requests=\(length)"
' "$LAB/access.jsonl"
jq -rs '
  group_by(.host)[] |
  "host=\(.[0].host) bytes=\(map(.bytes_sent)|add) requests=\(length)"
' "$LAB/access.jsonl"
Downloads account for 900,000,000 of 3,557,000,000 origin bytes in the example. A visitor-count formula can miss that concentration. Partial 206 responses also matter: repeated range requests may be legitimate resume behavior, media seeking, or aggressive clients. Keep status and content class in the receipt rather than multiplying one “average page.”
Bot transfer should remain visible in the measured total if the server or provider carried it. Create a separate scenario only when a verified WAF or CDN change will prevent that traffic from reaching the metered boundary. For logged-in membership traffic, membership hosting workload guidance explains why private responses often bypass shared caching. Review CDN cache-key boundaries before assuming every HTML byte can become an edge hit.
Reject Incomplete History Before You Project a Month
Compressed and rotated logs are frequent sources of undercount. A command that reads only access.log can omit access.log.1 and older .gz files; a vhost split can omit downloads; a timezone boundary can create six full days plus two partial ones. Record expected dates and make missing history a hard failure.
The negative control keeps seven distinct date labels but replaces the middle date, August 4, with August 8. A weak distinct-day count would accept it; the declared-window gate must reject both the missing expected date and the unexpected replacement.
set -Eeuo pipefail
LAB=/tmp/voxfor-nginx-bandwidth-lab
[[ "$(<"$LAB/.marker")" == 'voxfor-nginx-bandwidth-lab-v1' ]]
[[ -f "$LAB/access.jsonl" && ! -L "$LAB/access.jsonl" ]]
jq -c 'if .ts[0:10] == "2026-08-04" then .ts = ("2026-08-08" + .ts[10:]) else . end' "$LAB/access.jsonl" > "$LAB/wrong-window.jsonl"
python3 - "$LAB/window.json" "$LAB/wrong-window.jsonl" <<'PY'
import json, sys
from datetime import date, timedelta
manifest = json.load(open(sys.argv[1], encoding="utf-8"))
start = date.fromisoformat(manifest["start_date"])
expected = {(start + timedelta(days=offset)).isoformat() for offset in range(manifest["expected_days"])}
rows = [json.loads(line) for line in open(sys.argv[2], encoding="utf-8")]
observed = {row["ts"][:10] for row in rows}
if observed == expected:
    raise SystemExit("wrong_window=unexpected_accept")
missing = ",".join(sorted(expected - observed))
unexpected = ",".join(sorted(observed - expected))
print(f"window_control=rejected missing={missing} unexpected={unexpected} days={len(observed)}")
PY
Production validation should also compare file coverage with NGINX configuration and provider dates. Confirm every intended server or location log destination, whether logging is conditional, whether CDN-only hostnames exist, and whether the export covers the billing timezone. A checksum and read-only source copy make the calculation repeatable after the live files rotate again.
Turn Observed Bytes Into a Range, Not a Promise
Start with the measured run rate: observed bytes ÷ observed days × 30. Then declare only factors tied to a real expectation. The example uses a 15% base-growth factor and an additional 1.8× campaign factor. Those are worked assumptions, not universal safety margins.
set -Eeuo pipefail
LAB=/tmp/voxfor-nginx-bandwidth-lab
[[ "$(<"$LAB/.marker")" == 'voxfor-nginx-bandwidth-lab-v1' ]]
[[ -f "$LAB/access.jsonl" && ! -L "$LAB/access.jsonl" ]]
python3 - "$LAB/access.jsonl" <<'PY'
import json, sys
rows = [json.loads(line) for line in open(sys.argv[1], encoding="utf-8")]
days = len({row["ts"][:10] for row in rows})
measured = sum(row["bytes_sent"] for row in rows)
monthly = measured / days * 30
scenarios = {
    "low_measured_run_rate": monthly,
    "base_15pct_growth": monthly * 1.15,
    "high_growth_plus_campaign": monthly * 1.15 * 1.80,
}
for name, value in scenarios.items():
    print(f"scenario={name} decimal_GB={value / 1_000_000_000:.3f}")
PY
Use the same unit as the offer. Decimal GB divides by 1,000,000,000; GiB divides by 1,073,741,824. A plan labeled “1 TB” may use decimal or binary accounting, and it may reset on a calendar date rather than a rolling 30-day window. Ask instead of silently converting.
Here is the representative receipt produced by the complete eight-input sequence:
fixture=created records=21
schema=valid start=2026-08-01 end=2026-08-07 days=7 records=21
day=2026-08-01 bytes=381000000
day=2026-08-02 bytes=431000000
day=2026-08-03 bytes=421000000
day=2026-08-04 bytes=481000000
day=2026-08-05 bytes=481000000
day=2026-08-06 bytes=621000000
day=2026-08-07 bytes=741000000
origin_total_bytes=3557000000 body_bytes=3549991600 request_bytes=11270
class=download bytes=900000000 requests=7
class=page bytes=2650000000 requests=7
class=protocol bytes=7000000 requests=7
host=downloads.example.test bytes=900000000 requests=7
host=www.example.test bytes=2657000000 requests=14
window_control=rejected missing=2026-08-04 unexpected=2026-08-08 days=7
scenario=low_measured_run_rate decimal_GB=15.244
scenario=base_15pct_growth decimal_GB=17.531
scenario=high_growth_plus_campaign decimal_GB=31.556
origin_bytes=3557000000 edge_bytes=12400000000 signed_difference_bytes=8843000000 edge_to_origin_ratio=3.49
metering_boundary=separate_origin_and_edge_receipts
cleanup=verified path_absent=/tmp/voxfor-nginx-bandwidth-lab
These tiny planning values are not plan recommendations. They prove that the arithmetic, scenario labels, rejection control, and boundary comparison agree with the published inputs.
Reconcile Origin, CDN, and Provider Evidence Before Buying
A CDN changes what the origin sees. Edge cache hits can reach visitors without generating an origin response, while cache misses and private traffic still reach NGINX. Cloudflare’s current HTTP request log fields distinguish edge response bytes from origin-facing dimensions, and its common calculation guidance describes filters for estimating origin-served bytes.
The final comparison adds an explicitly labeled seven-day edge summary to the same worked period. It does not merge the two totals; it measures their relationship.
set -Eeuo pipefail
LAB=/tmp/voxfor-nginx-bandwidth-lab
[[ "$(<"$LAB/.marker")" == 'voxfor-nginx-bandwidth-lab-v1' ]]
[[ -f "$LAB/access.jsonl" && ! -L "$LAB/access.jsonl" ]]
cat > "$LAB/cdn-edge-summary.json" <<'JSON'
{"period_start":"2026-08-01","period_end":"2026-08-07","scope_hosts":["downloads.example.test","www.example.test"],"edge_bytes_sent":12400000000,"source":"worked-example-cdn-report"}
JSON
python3 - "$LAB/window.json" "$LAB/access.jsonl" "$LAB/cdn-edge-summary.json" <<'PY'
import json, sys
manifest = json.load(open(sys.argv[1], encoding="utf-8"))
rows = [json.loads(line) for line in open(sys.argv[2], encoding="utf-8")]
edge = json.load(open(sys.argv[3], encoding="utf-8"))
assert edge["period_start"] == manifest["start_date"]
assert edge["period_end"] == manifest["end_date"]
assert sorted(edge["scope_hosts"]) == sorted(manifest["hosts"])
assert isinstance(edge["edge_bytes_sent"], int) and edge["edge_bytes_sent"] >= 0
origin = sum(row["bytes_sent"] for row in rows)
assert origin > 0
difference = edge["edge_bytes_sent"] - origin
print(f"origin_bytes={origin} edge_bytes={edge['edge_bytes_sent']} signed_difference_bytes={difference} edge_to_origin_ratio={edge['edge_bytes_sent']/origin:.2f}")
print("metering_boundary=separate_origin_and_edge_receipts")
PY
The worked receipts produce an edge-to-origin ratio of 3.49 and a signed difference of 8,843,000,000 bytes. Neither number is a cache-hit ratio, and the code does not require edge bytes to exceed origin bytes. Bypass traffic, response headers, compression, retries, revalidation, range requests, tiered caching, and reporting scope can move the totals in either direction. Use a CDN’s own cache-status and origin fields for that separate calculation.
Provider meters may also include backups, package downloads, container images, mail, DNS, control-panel traffic, object storage, or outbound application calls that never appear in a public web access log. Compare the same UTC window with the provider total. Investigate the residual instead of adding a generic percentage.
Current VPS transfer allowances publish region-specific monthly traffic and uplink values. Use the measured low/base/high range to compare offers, then confirm reset date, counted directions, CDN treatment, overage or throttling policy, and whether traffic outside HTTP shares the allowance. The page is offer evidence; NGINX logs remain workload evidence.
Transfer is only one capacity dimension. Run website storage sizing separately for files, databases, local backups, and growth. CPU, RAM, database contention, and application latency also require their own receipts.
The forecast is ready for a hosting decision when the export covers every declared UTC date and virtual host, every record passes schema checks, measured daily and workload totals reconcile to the exact origin sum, the incomplete-window control is rejected, each scenario names its factor, CDN and provider totals remain separate, and the final allowance comparison uses the provider’s stated units and metering boundary.
Remove the disposable example only after the exact marker and path agree:
set -Eeuo pipefail
LAB=/tmp/voxfor-nginx-bandwidth-lab
[[ "$LAB" == '/tmp/voxfor-nginx-bandwidth-lab' ]]
[[ "$(<"$LAB/.marker")" == 'voxfor-nginx-bandwidth-lab-v1' ]]
find "$LAB" -xdev -type f -delete
rmdir "$LAB"
[[ ! -e "$LAB" ]]
printf 'cleanup=verified path_absent=%s\n' "$LAB"
If validation or projection fails, preserve the original read-only export and stop before using its forecast. Delete only the derived incomplete file, scenario output, and marker-guarded lab after reviewing the exact path; do not alter production NGINX logs. Return to the missing dates, virtual hosts, rotated files, CDN report, or provider receipt, rebuild a complete secret-free export, and rerun the checks from the beginning.
The buyer’s final packet should contain the immutable export checksum, UTC coverage, included hosts, field definitions, daily totals, workload contributors, low/base/high assumptions, CDN edge total, provider-meter total, allowance wording, and the owner of the next review. That packet makes a hosting change explainable even when traffic grows differently than expected.
FAQ: Questions Buyers Ask After the First Forecast
Should I sum $bytes_sent or $body_bytes_sent?
Use $bytes_sent when estimating the complete NGINX response-side transfer because it includes response bytes sent to the client, while $body_bytes_sent excludes response headers. Keep $request_length separate for incoming HTTP request bytes, and confirm which directions the hosting provider counts.
Is seven days enough for a website bandwidth estimate?
Seven complete days can establish a weekly pattern for a steady site, but it is not automatically representative. Compare multiple weeks and include separate campaign, season, launch, download, and bot windows when they materially change traffic. A complete longer period is better than a short period multiplied with false precision.
Why is CDN bandwidth larger than the NGINX total?
CDN edge caches can serve visitors without contacting the origin, so those bytes never appear in the origin’s NGINX response log. Compare edge and origin reports for the same dates, hostnames, statuses, and units; do not add them unless the provider’s billing model explicitly counts both as separate charges.
Can monthly GB tell me whether a 100 Mbps port is enough?
No. Monthly GB is transfer volume, while 100 Mbps is an instantaneous rate limit. Measure peak throughput, concurrency, response sizes, and latency separately. Dividing monthly bytes by every second in the month produces an average that can hide campaign or download spikes.
Should bots and large downloads stay in the forecast?
Keep bytes that actually crossed the metered boundary. Separate verified bots, downloads, range responses, APIs, and private pages so each contributor has an owner. Remove a contributor from a future scenario only when a tested control, architecture change, or product decision will keep it from that boundary.
How can I share access-log evidence safely?
Aggregate locally and share totals whenever possible. If records are required, remove raw client IPs, cookies, authorization values, query strings, email addresses, and other personal data; restrict file permissions; use a declared UTC window; and retain a checksum so reviewers analyze the same secret-free export.