Lifetime VPS Europe
 Lifetime VPS Asia
 Lifetime WooCommerce Hosting
 Lifetime Hosting
 Lifetime Game Dedicated Servers
 Chicago, US
 Tokyo, Japan
 Singapore
 Hong Kong
 Seoul, South Korea
 Amsterdem, Netherlands
 London, UK
 Stockholm, Sweden
 Oslo, Norway
 Vienna, Austria
 Zurich, Switzerland
 Sydney, Australia
 Wordpress Hosting
 VPS Hosting
 DDOS Protection
 Submit Ticket
 Full Management
 Guides
 Videos and Podcasts
 Discover Creative Ideas
 Voxfor Autonomous AI Workers
 Voxfor Mega Menu
 Voxfor Advanced Price Management For WooCommerce
 Voxfor Secure Live Chat and AI Support
 Voxfor Multilanguage
 Voxfor AI Content Summary
 Voxfor Autopilot
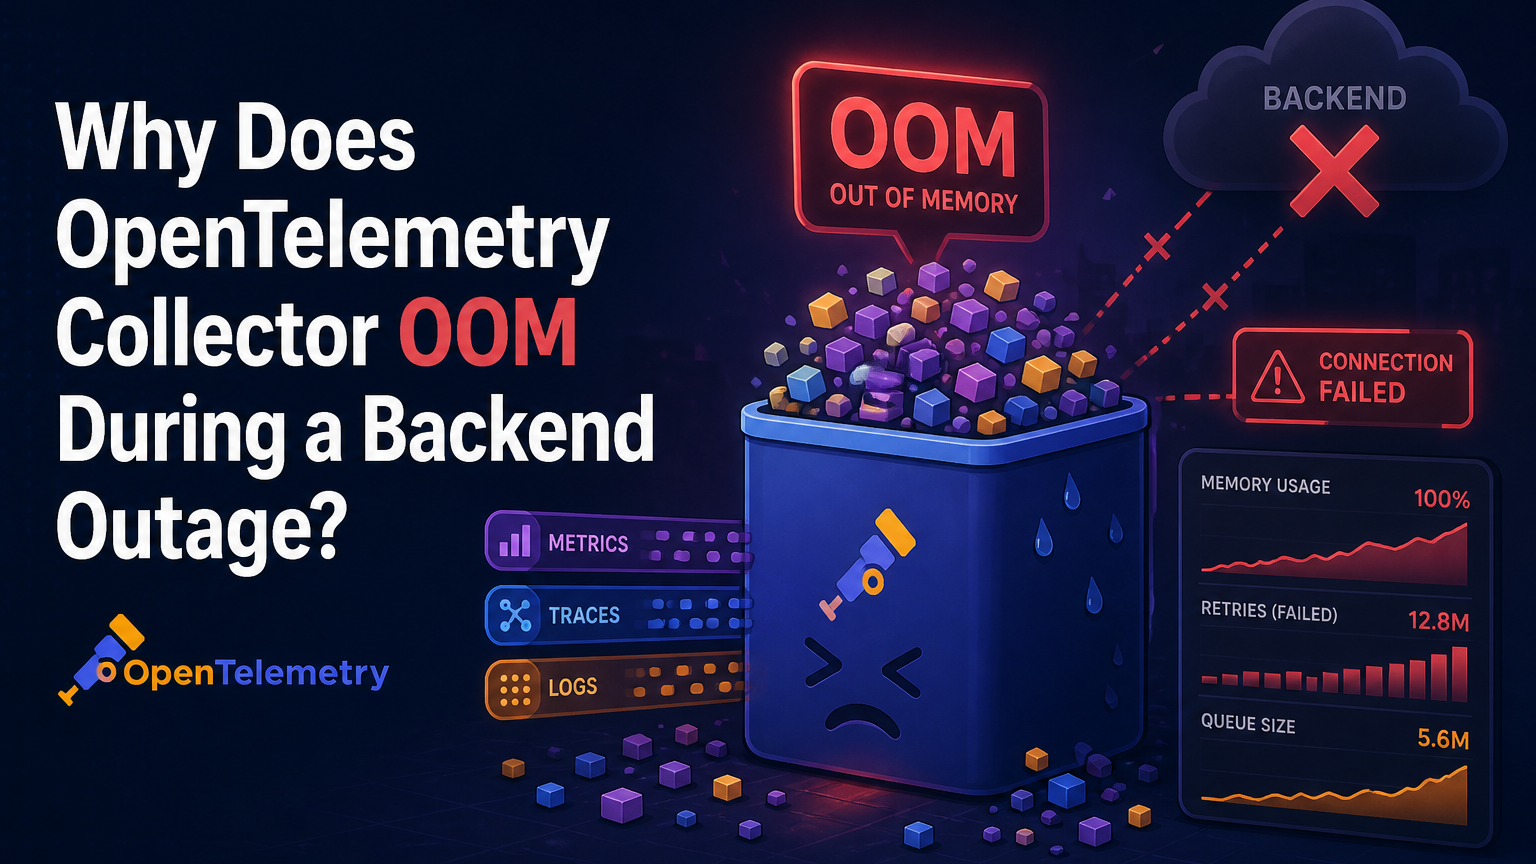
An OpenTelemetry Collector can run out of memory during a backend outage because exporter queues retain telemetry as live objects while new data continues to arrive. Garbage collection cannot reclaim those queued objects. The memory_limiter processor can refuse new input and force GC, but it does not evict live queue contents or enforce the operating system’s hard limit.
Stable operation therefore needs one coordinated budget: the container or service limit outside the process, GOMEMLIMIT inside the Go runtime, soft and hard thresholds inside memory_limiter, and a finite exporter queue. OpenTelemetry’s current memory limiter documentation explicitly warns that data may allocate before rejection and that forced GC can be ineffective while exporter queues hold live references.
Start with one envelope, not three percentages
Treat the operating-system limit as the outside wall. Everything else must fit inside it, including Go heap and runtime-managed memory, thread stacks, native allocations, component overhead, queued telemetry, and transient allocations made before the limiter sees a request.
For a 2 GiB container, OpenTelemetry currently recommends setting GOMEMLIMIT to 80% of the collector’s hard memory limit. A matching limit_percentage: 80 gives the limiter a 1,638 MiB hard target, while spike_limit_percentage: 15 makes the soft threshold about 1,331 MiB. The remaining space is headroom, not spare queue capacity.
| Boundary | Example for 2 GiB container | What it actually controls | What it does not promise |
|---|---|---|---|
| Container/cgroup limit | 2,048 MiB | Kernel-enforced process-group ceiling | Graceful telemetry rejection |
GOMEMLIMIT |
1,638 MiB | Go runtime memory target and GC pacing | Exact RSS cap or collection of live objects |
| Limiter hard threshold | 80% = 1,638 MiB | Forced GC above the configured target | Queue eviction or OS enforcement |
| Limiter soft threshold | 80% – 15% = 65% | Refusal/backpressure until usage falls | Infinite upstream retries |
Those figures are a starting point, not a universal capacity formula. The Go GC memory-limit guide describes a soft runtime limit with a CPU-versus-memory tradeoff. If most of the heap is still reachable, more frequent GC spends CPU without releasing the objects that matter.
RSS alone cannot assign ownership. Compare it with runtime memory, queue occupancy, refused telemetry, exporter failures, and the cgroup event that actually killed the process. A rising RSS line tells you pressure exists; it does not tell you whether the queue, batch processor, receiver burst, transform, or runtime overhead owns it.
Follow the objects that remain live
Backend failure changes the lifetime of telemetry. Under normal conditions, batches enter an exporter queue, leave through a consumer, and become collectible. When the destination slows or stops, the queue keeps references for longer, retries keep requests in flight, and incoming batches compete for the same envelope.
Queue size deserves workload evidence rather than a copied batch count. OpenTelemetry’s current exporter helper contract supports requests, items, or bytes as the queue sizer. requests is the most performant unit, but one request may contain dramatically more telemetry than another; bytes is more explicit and more expensive to measure.
Payload variance can begin before the Collector. Prometheus label multiplication guide shows how one label can expand a metric series set, which then changes both ingestion volume and the memory cost of buffering an outage. Measure representative large batches, not only average requests.
Put the limiter first
Place memory_limiter first in every signal pipeline. That ordering lets refusal travel toward a receiver as early as possible and avoids spending more memory on later processors before the limit check.
Refusal is intentionally non-permanent. A compatible preceding component may retry or apply backpressure, but the official documentation warns that data can be lost when the preceding component cannot retry indefinitely. An operator must decide where loss is acceptable; adding a larger queue only postpones that decision.
Persistent queues change recovery, not capacity
Adding the file_storage extension can let a persistent exporter queue resume after a Collector restart. Persistence still has a finite queue_size, and disk-full or I/O failure can prevent enqueueing. Authentication-extension context is not preserved through the persistent queue either, according to exporter-helper documentation.
Gateway collectors with node-local queue storage also need Kubernetes drain readiness because a clean pod restart is different from losing the node that holds the queue. Use a volume and placement model that matches the recovery promise; do not label local persistence as high availability.
Four signals separate pressure from failure
Memory incidents become easier to classify when each observation has one owner. Avoid a single alert named “Collector unhealthy,” because it hides whether the process is rejecting telemetry safely, losing data at the queue, burning CPU in GC, or already dead.
| Signal | Meaning | Immediate decision |
|---|---|---|
| Limiter refused counters increase | Soft threshold was crossed and pipeline input was rejected | Verify upstream retry/backpressure and reduce retained work |
| Queue size approaches capacity | Destination drain rate is below arrival rate | Restore backend throughput or enforce a loss boundary |
| Enqueue-failed counters increase | Data could not enter the sending queue and never reached exporter retry | Treat as confirmed loss at this Collector boundary |
OOMKilled or cgroup memory event |
OS boundary ended the process | Reconstruct ownership; a restart alone is not remediation |
Current component telemetry in v0.158.0 uses names such as otelcol_processor_memory_limiter_refused_spans, otelcol_exporter_queue_size, otelcol_exporter_queue_capacity, and otelcol_exporter_enqueue_failed_spans. Signal-specific suffixes exist for log records and metric points. These component metrics are alpha, so pin the Collector release and verify names after upgrades.
Container status can mislead: Docker healthcheck and restart behavior explains why an unhealthy state does not itself make a restart policy act. Conversely, an OOM exit may trigger an automatic restart that briefly clears memory and hides the unresolved queue/back-end relationship.
Alert semantics matter after a crash. Grafana no-data and error policy helps distinguish a genuinely absent Collector series from an evaluation or data-source error. Keep one external availability signal so the Collector is not solely responsible for reporting its own death.
FAQ: Questions that change the budget
Does memory_limiter prevent every Collector OOM?
OpenTelemetry memory_limiter does not prevent every OOM. It reduces risk by refusing input above a soft threshold and forcing GC above a hard threshold, but incoming data may allocate before rejection and live queued objects cannot be garbage-collected.
Why must memory_limiter be the first processor?
First position lets OpenTelemetry Collector return backpressure before later processors allocate more memory or transform the batch. Every traces, metrics, and logs pipeline should list the limiter first.
Should an exporter queue be sized in requests, items, or bytes?
Use the unit that bounds real workload variance. Requests are fastest to count, items expose signal volume, and bytes give a more explicit serialized-data ceiling at higher measurement cost; none equals exact Go heap use.
Does a persistent queue guarantee zero telemetry loss?
A persistent queue does not guarantee zero loss. OpenTelemetry persistent queues can survive a process restart, but they remain finite and can reject data when capacity, disk space, or I/O fails. Their storage and node-failure model must match the promised recovery boundary.
Should GOMEMLIMIT equal the container memory limit?
GOMEMLIMIT should not equal the container limit. Current OpenTelemetry guidance recommends starting at 80% of the Collector hard memory limit so the process retains headroom outside the Go runtime target. Validate the final value under representative load.
Will adding Collector replicas fix a blocked backend?
Not by itself. More replicas distribute ingest only when routing and backend capacity can drain the added work; otherwise each replica can build its own finite queue and multiply the total buffered data.
Coordinate configuration at deployment time
Containerized collectors can use percentage-based limiter settings because Linux cgroups expose the available limit. Teams using Docker Compose deployment boundaries should keep the resource limit and runtime environment beside the version-pinned Collector service, while the pipeline configuration stays reviewable as a separate file.
processors:
  memory_limiter:
    check_interval: 1s
    limit_percentage: 80
    spike_limit_percentage: 15
  batch: {}

exporters:
  otlp:
    endpoint: telemetry-backend.example:4317
    sending_queue:
      enabled: true
      sizer: bytes
      queue_size: 268435456  # Example 256 MiB serialized ceiling; load-test it
    retry_on_failure:
      enabled: true
      max_elapsed_time: 5m

service:
  pipelines:
    traces:
      receivers: [otlp]
      processors: [memory_limiter, batch]
      exporters: [otlp]
One matching Compose fragment makes the outside wall explicit:
services:
  otel-collector:
    image: otel/opentelemetry-collector-contrib:0.158.0
    environment:
      GOMEMLIMIT: 1638MiB
    mem_limit: 2g
    volumes:
      - ./otelcol.yaml:/etc/otelcol-contrib/config.yaml:ro
Bare-VM services should prefer fixed MiB values when throughput is known. A systemd cgroup can still supply an outside limit, avoiding a Collector that competes with every other service on the host.
[Service]
Environment=GOMEMLIMIT=1600MiB
MemoryMax=2G
Restart=on-failure
RestartSec=5s
Match that unit with limit_mib: 1600 and a measured spike allowance such as spike_limit_mib: 320. Reload the manager, restart only during a maintenance window, and keep the previous drop-in plus Collector config as the rollback pair. A lower limit that causes continuous refusal is not stability.
Observe the queue without depending on it
OpenTelemetry exposes internal metrics on its telemetry endpoint; Collector internal telemetry documentation defines queue capacity and current queue size. Capture deltas rather than isolated counter values, and label dashboards by exporter plus signal so one healthy path does not hide another blocked one.
curl -fsS http://127.0.0.1:8888/metrics \
  | grep -E 'otelcol_(exporter_queue|exporter_enqueue_failed|processor_memory_limiter_refused|process_memory_rss)'
Useful ratios include queue size divided by capacity, refused items divided by received items, enqueue failures per minute, and export failures versus successful sends. Track process RSS beside runtime memory and GC CPU. If queue occupancy remains high after the backend recovers, consumers, retry timing, or downstream throughput still limits drain.
OpenTelemetry’s Collector scaling guidance treats refusal and sustained resource pressure as scaling evidence, not a command to add replicas blindly. Confirm that the backend and load-balancing path can accept the extra concurrency before distributing more queues.
Prove degradation with a backend-outage test
Run the test in staging with a representative but disposable telemetry stream. Record the Collector version, container/service limit, GOMEMLIMIT, limiter thresholds, queue unit/capacity, normal arrival rate, normal export rate, and maximum acceptable loss before introducing the fault.
- Capture five minutes of steady-state RSS, runtime memory, queue occupancy, export success, refusal, and enqueue-failure deltas.
- Stop or delay the test backend for a bounded interval shorter than the designed queue window.
- Confirm queue growth stays inside the planned envelope and the process remains below the OS limit.
- Extend only far enough to cross the soft limit; verify refusals are visible and upstream retry behavior matches the receiver contract.
- Restore the backend and measure drain time, peak RSS, GC CPU, refused data, enqueue failures, and final delivery count.
- Repeat with one large-payload burst because averages do not test the spike allowance.
For a disposable Compose lab, the outage and recovery boundary can be explicit:
docker compose stop otlp-backend
# Observe only for the approved fault window.
docker compose start otlp-backend
Pass the design only when memory returns toward baseline, queue occupancy drains, no unexpected enqueue failures occur, and the measured loss stays inside policy. Fail it when restart is the only recovery, GC stays busy against live data, the queue never drains, or the cgroup kills the process before refusal becomes useful.
The final capacity record is a contract, not a percentage: outside memory limit, runtime target, limiter soft/hard thresholds, queue unit/capacity, tested arrival rate, tested outage duration, peak RSS, loss observed, and drain time. That record tells the next operator whether a changed payload, backend, or Collector release invalidated the budget.