Lifetime VPS Europe
 Lifetime VPS Asia
 Lifetime WooCommerce Hosting
 Lifetime Hosting
 Lifetime Game Dedicated Servers
 Chicago, US
 Tokyo, Japan
 Singapore
 Hong Kong
 Seoul, South Korea
 Amsterdem, Netherlands
 London, UK
 Stockholm, Sweden
 Oslo, Norway
 Vienna, Austria
 Zurich, Switzerland
 Sydney, Australia
 Wordpress Hosting
 VPS Hosting
 DDOS Protection
 Submit Ticket
 Full Management
 Guides
 Videos and Podcasts
 Discover Creative Ideas
 Voxfor Autonomous AI Workers
 Voxfor Mega Menu
 Voxfor Advanced Price Management For WooCommerce
 Voxfor Secure Live Chat and AI Support
 Voxfor Multilanguage
 Voxfor AI Content Summary
 Voxfor Autopilot
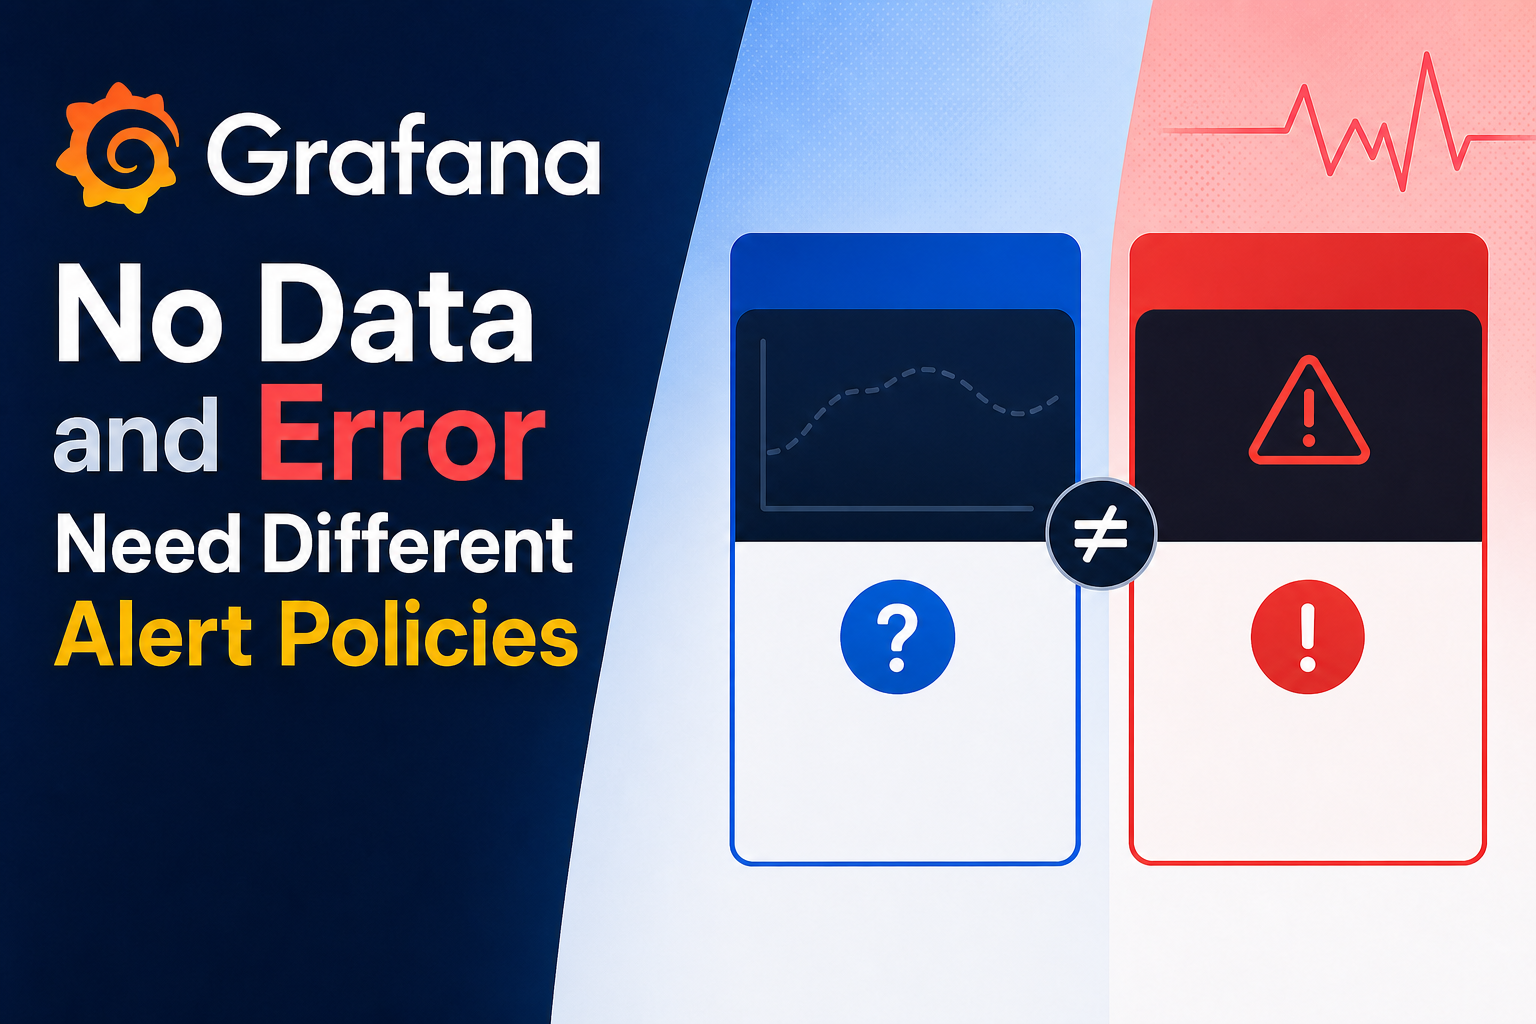
Grafana No Data means a rule query completed but returned no points. Error means the evaluation failed, timed out, or exhausted its configured attempts. A third case, Missing Series, means one previously seen label set disappeared while other series still returned data. Treating all three as “the alert is broken” hides who owns the incident and can route the wrong page.
For Grafana-managed rules, decide each outcome explicitly: page on missing telemetry when silence is dangerous, keep or normalize state only when emptiness is expected, preserve a separate signal for data-source failure, and test that the resulting labels reach the intended notification policy. A green application threshold is not proof that the monitoring path is healthy.
One evaluation can produce four different stories
Threshold state, data availability, and rule health are separate dimensions. Current Grafana documentation for No Data and Error defines the special states only for Grafana-managed alert rules, so first confirm whether Grafana or the data source owns evaluation.
| Evaluation result | What Grafana actually learned | First owner to investigate |
|---|---|---|
| Values returned | The query ran and threshold logic can decide Normal, Pending, or Alerting | workload or threshold design |
| No Data | The query ran successfully but returned no data points at all | target presence, time range, or query semantics |
| Missing Series | Some dimensions remain, but one previous alert instance stopped appearing | lifecycle, labels, or one missing target |
| Error | Grafana could not complete evaluation because of failure, timeout, or repeated unsuccessful attempts | data source, network, credentials, query cost, or Grafana capacity |
That classification prevents a common false conclusion. Suppose a latency rule returns one series per region. If every region disappears, the result is No Data. If only region=eu-west disappears, the surviving regions keep the query nonempty and the missing instance follows Grafana’s stale-series behavior instead. If the Prometheus request times out, the rule is in Error even though the targets may still be exporting metrics.
Multi-dimensional rules also make label design operational. A changing label can retire one alert instance and create another, while an uncontrolled label can multiply far more instances than operators expect. For label-shape problems, Prometheus cardinality diagnosis provides the separate TSDB ownership workflow.
Choose policy from the cost of being blind
No global setting is correct for every rule. The useful question is: what does an empty or failed evaluation mean for this particular service promise? A batch job that exists only during a nightly window should not page at noon, while disappearance of every up series for production exporters is itself an incident.
Grafana offers four behaviors for No Data: set No Data, set Alerting, set Normal, or keep the last state. Error has the parallel choices set Error, set Alerting, set Normal, or keep the last state. Defaults create the special states; changing them alters the original alert instance rather than proving that the underlying monitoring path recovered.
| Rule contract | No Data choice | Error choice | Required companion evidence |
|---|---|---|---|
| Always-on service must report | No Data or Alerting | Error or Alerting | independent scrape/data-source health |
| Ephemeral workload may legitimately vanish | Normal or Keep Last State | Error | lifecycle signal proving disappearance was expected |
| Business metric is sparse by design | Normal, after verifying query semantics | Error | separate pipeline freshness or ingestion check |
| Safety alert must fail closed | Alerting | Alerting | dedicated routing and tested runbook |
Keep Last State is a noise-control tool, not a health proof. Grafana warns that it can hide prolonged data-source disruption when used alone. If temporary gaps should not flip an alert, pair the rule with a separate check for exporter presence, query success, or data freshness. Uptime Kuma monitoring placement is useful when an external liveness path must survive the same host failure that takes Grafana down.
Pending periods deserve equal attention. Current Grafana behavior applies the pending period to No Data and Error transitions; a zero duration enters the selected special state immediately. Increasing the period can absorb brief gaps, but it also delays a real monitoring-path alarm. Choose a duration from expected scrape and ingestion delay, then prove the delay with a controlled failure rather than copying the application threshold’s pending value.
Clocked evaluations depend on trustworthy time ranges. When query windows appear empty at boundaries or several hosts disagree about event order, Linux clock-drift recovery should precede alert-policy tuning.
Missing Series is not a smaller No Data event
Missing Series happens when a rule still returns data but a previously created alert instance no longer exists in the result. Grafana keeps that instance’s prior state for the configured number of missing-series evaluations, then marks it stale, transitions it to Normal, and records grafana_state_reason: MissingSeries. A previously firing instance can therefore emit a resolved notification even though the target disappeared rather than recovered.
Start from expected membership
For a fixed fleet, absence can be modeled directly. Prometheus provides functions such as absent_over_time() for all-data disappearance:
absent_over_time(up{job="api"}[10m]) == 1That expression detects when no matching up samples exist during the range. It does not automatically identify which dynamic label set vanished. Hard-coding every pod, tenant, or region becomes brittle as membership changes.
Dynamic fleets need an expectation source: service discovery, inventory, deployment state, a heartbeat metric, or comparison between a recent window and an older window. Grafana’s missing-data guidance demonstrates present_over_time() and offset-based approaches for discovering label sets that existed before but no longer report. Use those techniques only when the chosen offset represents a meaningful expected population; a deployment that intentionally scaled down should not be treated as a silent outage.
Keep identity labels stable
Labels that change with severity, current value, or free-form text create new alert identities. Grafana then sees the old label set disappear and the new one arrive. Put changing context in annotations, while labels retain stable routing and ownership fields such as service, environment, region, and team.
Before changing the stale-series interval, inspect alert history for Normal (Missing Series) and confirm whether instances truly vanished or merely changed identity. Raising the interval hides churn; it does not repair unstable labels or missing telemetry.
Route special alerts as separate incidents
Default No Data and Error behavior creates DatasourceNoData or DatasourceError alert instances. Those instances have labels including alertname, datasource_uid, and rulename, and they are independent from the original threshold alert. Existing silences, mute timings, or notification-policy matches for the original labels may not apply.
Build a policy branch for those special alerts instead of assuming they inherit the application’s route. Grouping DatasourceError by datasource_uid can reduce a storm when one backend breaks many rules, while retaining rulename in notification context shows which coverage was lost. A No Data page may route to the service owner when one rule’s expected telemetry vanished; a shared data-source failure usually belongs to the observability owner.
Do not set Error to Normal simply to stop noise. Investigate query duration, credentials, network reachability, and data-source health first. Grafana documents a default evaluation timeout of 30 seconds and three attempts, while cautioning that global timeout or retry increases are a last resort because they affect all rules and can create missed evaluations. When Grafana shares a constrained server with its data source, VPS hosting capacity must leave CPU, memory, and I/O reserve for both evaluation and ingestion.
FAQ: Grafana alert-state decisions
Does No Data mean the data source is offline?
No Data does not mean the data source is offline. Grafana uses No Data when the query completed successfully but returned no points; an unavailable data source, timeout, or failed evaluation belongs to Error instead.
Should No Data always be set to Alerting?
Only when missing telemetry is itself dangerous should No Data become Alerting. Use Normal or Keep Last State when emptiness is expected and another signal proves the monitoring path remains healthy.
Is Keep Last State safe for production alerts?
Keep Last State is safe only as bounded noise control with separate detection for prolonged data-source or telemetry loss. Used alone, it can preserve a reassuring previous state while monitoring remains blind.
Why did DatasourceNoData bypass an existing silence?
DatasourceNoData is a separate alert instance with labels different from the original threshold alert. Notification policies, silences, and mute timing matches must be tested against those special labels explicitly.
What is Missing Series in Grafana Alerting?
Missing Series means one previously observed alert dimension disappeared while other series still returned data. Grafana eventually marks that instance stale and records grafana_state_reason: MissingSeries.
Does the pending period apply to No Data and Error?
Yes. Grafana-managed No Data and Error transitions honor the pending period. Setting it to zero makes the configured transition immediate; a longer period delays both transient noise and real monitoring-path failures.
Do No Data and Error settings apply to data source-managed rules?
Grafana’s configurable No Data and Error states apply only to Grafana-managed alert rules. Prometheus-managed or other data source-managed rules follow the evaluator’s own semantics and configuration.
Make the policy reviewable across environments
Clicking options in one Grafana instance is difficult to audit at scale. Grafana supports file provisioning, Terraform, and Alerting provisioning APIs for rules, contact points, notification policies, mute timings, and templates. File-provisioned resources are managed from their source rather than edited normally in the UI, so choose one source of truth and document ownership.
The rule fields make the decision visible in review. This fragment is illustrative; preserve the rest of an exported, version-compatible rule rather than assembling production JSON or YAML from a partial example:
noDataState: NoData
execErrState: Error
for: 5m
keepFiringFor: 2m
Available API/file values and resource shapes can change across Grafana releases, so export from the target instance and compare the result with current Grafana provisioning documentation. Do not mix file provisioning and UI edits for the same resource and assume the last click will persist.
Managed versus self-managed responsibility also belongs in the alert record. Managed-versus-unmanaged VPS responsibilities helps identify who owns Grafana upgrades, data-source credentials, notification delivery, host capacity, and the off-host monitor.
Test silence before trusting the rule
Threshold previews prove only the expression path with data present. Use a non-production rule or controlled test label set to exercise four receipts: a normal value, a threshold breach, an empty successful result, and an intentional evaluation failure. For multi-dimensional rules, remove one test series while leaving another present so Missing Series is observed separately from No Data.
Record the expected alert name, state, grafana_state_reason, labels, notification-policy route, grouping, pending delay, contact point, and resolved behavior for each test. Restore the test data source immediately after the Error case and confirm the rule resumes evaluation without manual state manipulation.
Release criteria are concrete: every expected silence has an owner, every special alert has a route, stale-series behavior matches workload lifecycle, and an external path can report loss of the monitoring stack itself. Only then does a quiet Grafana dashboard mean the monitored condition is normal rather than invisible.