Lifetime VPS Europe
 Lifetime VPS Asia
 Lifetime WooCommerce Hosting
 Lifetime Hosting
 Lifetime Game Dedicated Servers
 Chicago, US
 Tokyo, Japan
 Singapore
 Hong Kong
 Seoul, South Korea
 Amsterdem, Netherlands
 London, UK
 Stockholm, Sweden
 Oslo, Norway
 Vienna, Austria
 Zurich, Switzerland
 Sydney, Australia
 Wordpress Hosting
 VPS Hosting
 DDOS Protection
 Submit Ticket
 Full Management
 Guides
 Videos and Podcasts
 Discover Creative Ideas
 Voxfor Autonomous AI Workers
 Voxfor Mega Menu
 Voxfor Advanced Price Management For WooCommerce
 Voxfor Secure Live Chat and AI Support
 Voxfor Multilanguage
 Voxfor AI Content Summary
 Voxfor Autopilot
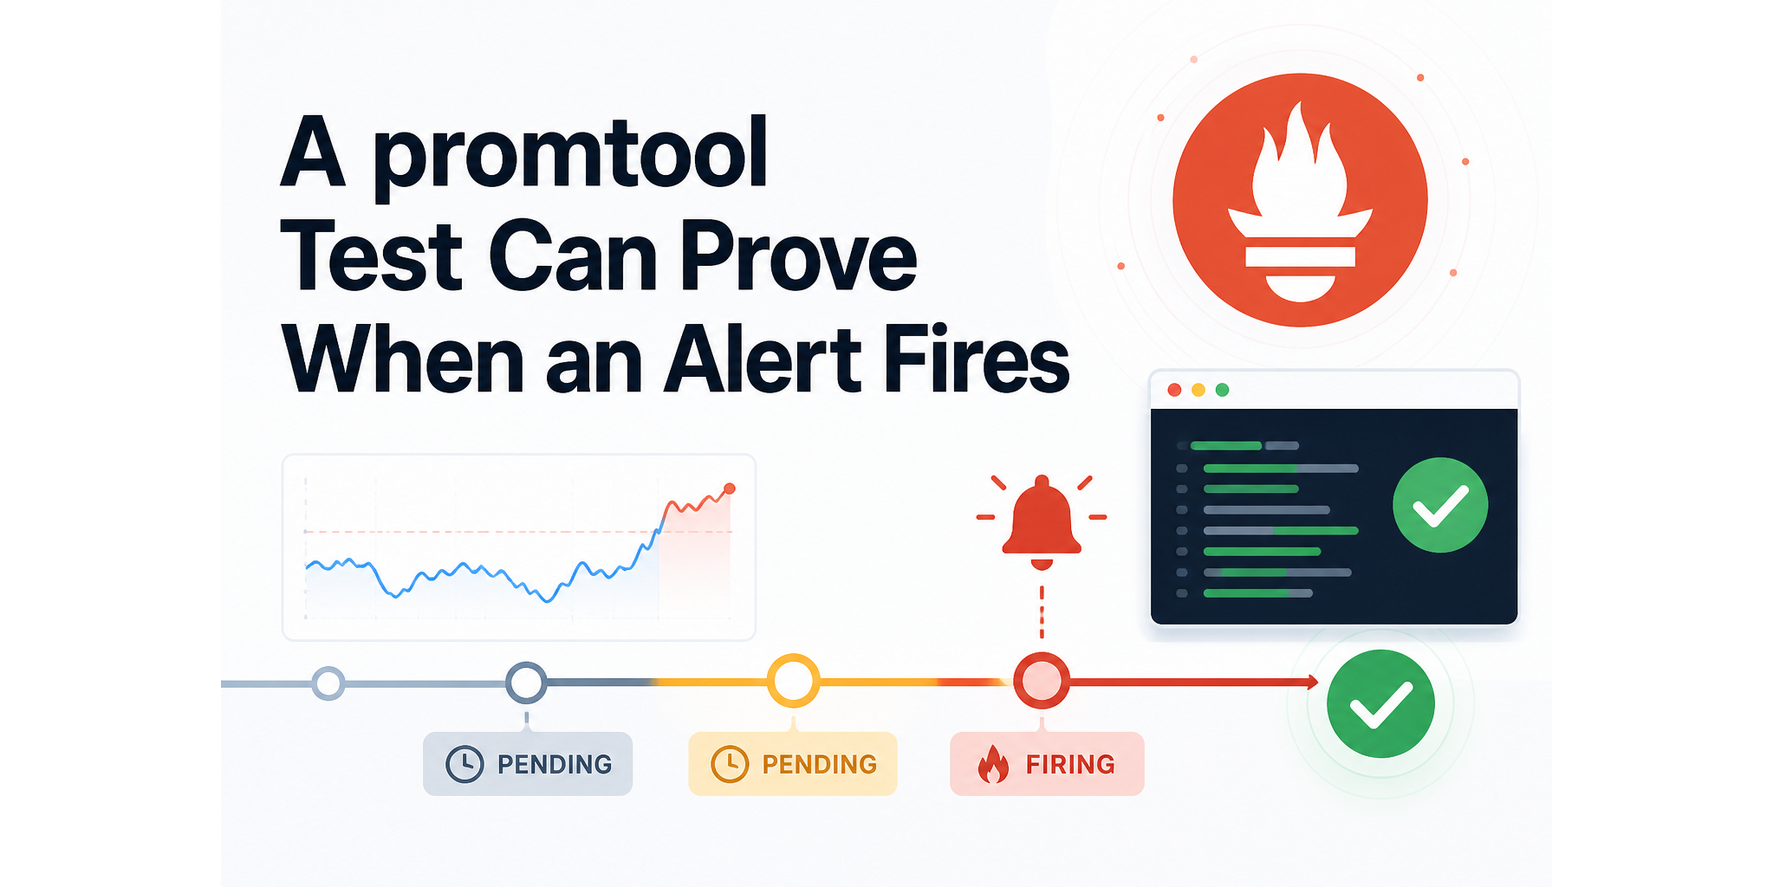
One deliberately wrong label stopped the reproduced alert suite. The test expected severity="warning"; the rule emitted severity="page"; promtool test rules exited 1 and showed both values. After the original expectation was restored, the same suite proved that a sustained 10% API error ratio was not firing at 3 minutes, started firing at 4 minutes, and carried the exact routing labels and summary.
That is more useful than a YAML syntax check. An alert can parse successfully yet fire too early, remain silent, route to the wrong team, or render a misleading annotation. A deterministic test turns those behaviors into a release contract before a Prometheus server loads the rule.
This practical guide is for operators and platform engineers who can read basic PromQL and YAML. The lab ran on Debian 13 with promtool 2.53.3 and Bash 5.2. It uses synthetic counters, starts no listener, installs no package into the host, reads no production metrics, and writes only under marker-owned /tmp/voxfor-promtool-rule-test. Apply the eight tested input blocks in order in one shell session.
Freeze the Alert Contract Before Writing YAML
Rule testing starts with observable promises, not a copied configuration. For this example, an API alert divides the two-minute rate of 5xx requests by the rate of all requests for each instance. The threshold is greater than 5%, and for: 3m requires the expression to remain active before the alert becomes firing.
Five assertions define whether that rule is ready to load:
| Assertion | Evaluation | Release meaning |
|---|---|---|
| rule file is valid | before simulation | PromQL and YAML can be parsed |
| sustained 10% errors are not firing | 3m |
the for period has not been shortened |
| the same series is firing | 4m |
the alert eventually crosses its hold time |
| sustained 1% errors stay inactive | 6m |
ordinary traffic remains below threshold |
| labels and annotation match | first firing | routing and operator context did not drift |
promtool evaluates synthetic series at fixed timestamps, so the receipt is reproducible and independent of a live scrape. Current Prometheus unit-testing documentation defines the file format, expanding series notation, empty expected-alert lists, labels, annotations and relative eval_time values. The article’s value is the joined acceptance path: both sides of the timing boundary, a healthy control, a deliberately wrong label and restored success.
Metric design remains upstream. If an alert uses latency percentiles, settle Prometheus histogram bucket design before testing the threshold. A perfect test cannot repair an expression built from unsuitable measurements.
Use One Versioned Tool Without Installing Prometheus
On Debian, the package separates promtool from the Prometheus server. apt-get download retrieves the exact package into the lab; dpkg-deb -x extracts it without modifying the host package database. A package hash and tool version make later reruns attributable.
Before any download, the first block refuses a pre-existing path rather than deleting unknown data. It creates a marker only after that check.
set -euo pipefail
LAB=/tmp/voxfor-promtool-rule-test
MARKER="$LAB/.voxfor-promtool-lab"
PACKAGE_VERSION='2.53.3+ds1-2'

if [[ -e "$LAB" ]]; then
  echo "Refusing existing path: $LAB" >&2
  exit 1
fi
mkdir -m 700 "$LAB"
touch "$MARKER"
cd "$LAB"

apt-get download "promtool=$PACKAGE_VERSION" >/dev/null
DEB=$(find "$LAB" -maxdepth 1 -type f -name 'promtool_*.deb' -print -quit)
[[ -n "$DEB" ]]
dpkg-deb -x "$DEB" root
PROMTOOL="$LAB/root/usr/bin/promtool"
[[ -x "$PROMTOOL" ]]
printf 'tool=%s\npackage_sha256=%s\n' \
  "$($PROMTOOL --version | awk 'NR==1 {print $3}')" \
  "$(sha256sum "$DEB" | awk '{print $1}')" > tool.receipt
cat tool.receipt
On another distribution, use the vendor release archive or container already approved by your team, then pin its digest or checksum. Avoid an unversioned latest tool in CI: test behavior and supported syntax can change across releases. The promtool command reference is the authoritative place to compare available flags with your pinned version.
Give the Rule One Measurable Promise
Grouping by instance gives each alert one routing identity. Its numerator includes only 5xx counters; the denominator includes every status. Both use the same two-minute range and label dimension, preventing an accidental many-to-many division.
set -euo pipefail
LAB=/tmp/voxfor-promtool-rule-test
MARKER="$LAB/.voxfor-promtool-lab"
[[ -f "$MARKER" ]]
cd "$LAB"

cat > api-alerts.yml <<'YAML'
groups:
- name: api-availability
  interval: 1m
  rules:
  - alert: ApiErrorBudgetBurning
    expr: |
      sum by (instance) (rate(api_requests_total{status=~"5.."}[2m]))
      /
      sum by (instance) (rate(api_requests_total[2m])) > 0.05
    for: 3m
    labels:
      severity: page
      team: platform
    annotations:
      summary: "API error ratio is high on {{ $labels.instance }}"
YAML
According to current Prometheus alerting-rule semantics, for keeps an active expression pending until the duration has elapsed. Pending is not firing. That distinction matters because Alertmanager receives firing alerts, not every moment when the expression is merely true.
Keep routing labels low-cardinality and stable. Putting request IDs, raw paths or user identifiers into alert labels multiplies series and notification groups. Use Prometheus label-cardinality diagnosis when the label set itself is uncertain; the unit test below checks exact values but does not measure their production population.
Encode Two Timelines, Not One Happy Path
Synthetic series use one-minute samples. 0+90x10 expands to an initial zero followed by ten increments of 90; the matching 5xx series increments by 10. Together they represent a stable 10% error ratio after rates become calculable. A second instance uses 99 successful and one failed request per interval, remaining at 1%.
At 3 minutes, the first case asserts an empty firing set; at 4 minutes it expects one fully expanded alert. The second case asserts no alert at 6 minutes. Exact labels include the source instance plus the rule’s severity and team; the annotation must render the instance value.
rule_files:
- api-alerts.yml
evaluation_interval: 1m
tests:
- name: sustained-ten-percent-errors
  interval: 1m
  input_series:
  - series: 'api_requests_total{instance="api-1",status="200"}'
    values: '0+90x10'
  - series: 'api_requests_total{instance="api-1",status="500"}'
    values: '0+10x10'
  alert_rule_test:
  - eval_time: 3m
    alertname: ApiErrorBudgetBurning
    exp_alerts: []
  - eval_time: 4m
    alertname: ApiErrorBudgetBurning
    exp_alerts:
    - exp_labels:
        instance: api-1
        severity: page
        team: platform
      exp_annotations:
        summary: "API error ratio is high on api-1"
- name: healthy-one-percent-errors
  interval: 1m
  input_series:
  - series: 'api_requests_total{instance="api-2",status="200"}'
    values: '0+99x10'
  - series: 'api_requests_total{instance="api-2",status="500"}'
    values: '0+1x10'
  alert_rule_test:
  - eval_time: 6m
    alertname: ApiErrorBudgetBurning
    exp_alerts: []
Save that block as api-alerts.test.yml inside the marked lab. Brian Brazil’s worked promtool unit-test explanation shows how expanding notation becomes timestamped samples. Here, two named cases keep the release decisions visible: persistent failure must page; healthy traffic must not.
Missing data deserves a separate policy. Zero, absent and stale samples are different states, and substituting a healthy zero for an absent series can suppress a real collection failure. Treat Grafana no-data and error policy as the next design step when missing series change the reader outcome; do not smuggle that separate intent into a healthy-ratio fixture.
Pause on Both Sides of the for Boundary
Syntax validation and behavior simulation answer different questions. Run check rules first so a malformed expression fails with a focused diagnostic. The block redeclares every path and confirms marker ownership instead of relying on shell variables from an earlier step.
set -euo pipefail
LAB=/tmp/voxfor-promtool-rule-test
MARKER="$LAB/.voxfor-promtool-lab"
PROMTOOL="$LAB/root/usr/bin/promtool"
[[ -f "$MARKER" && -x "$PROMTOOL" ]]
cd "$LAB"
"$PROMTOOL" check rules api-alerts.yml > syntax.out
grep -q 'SUCCESS' syntax.out
cat syntax.out
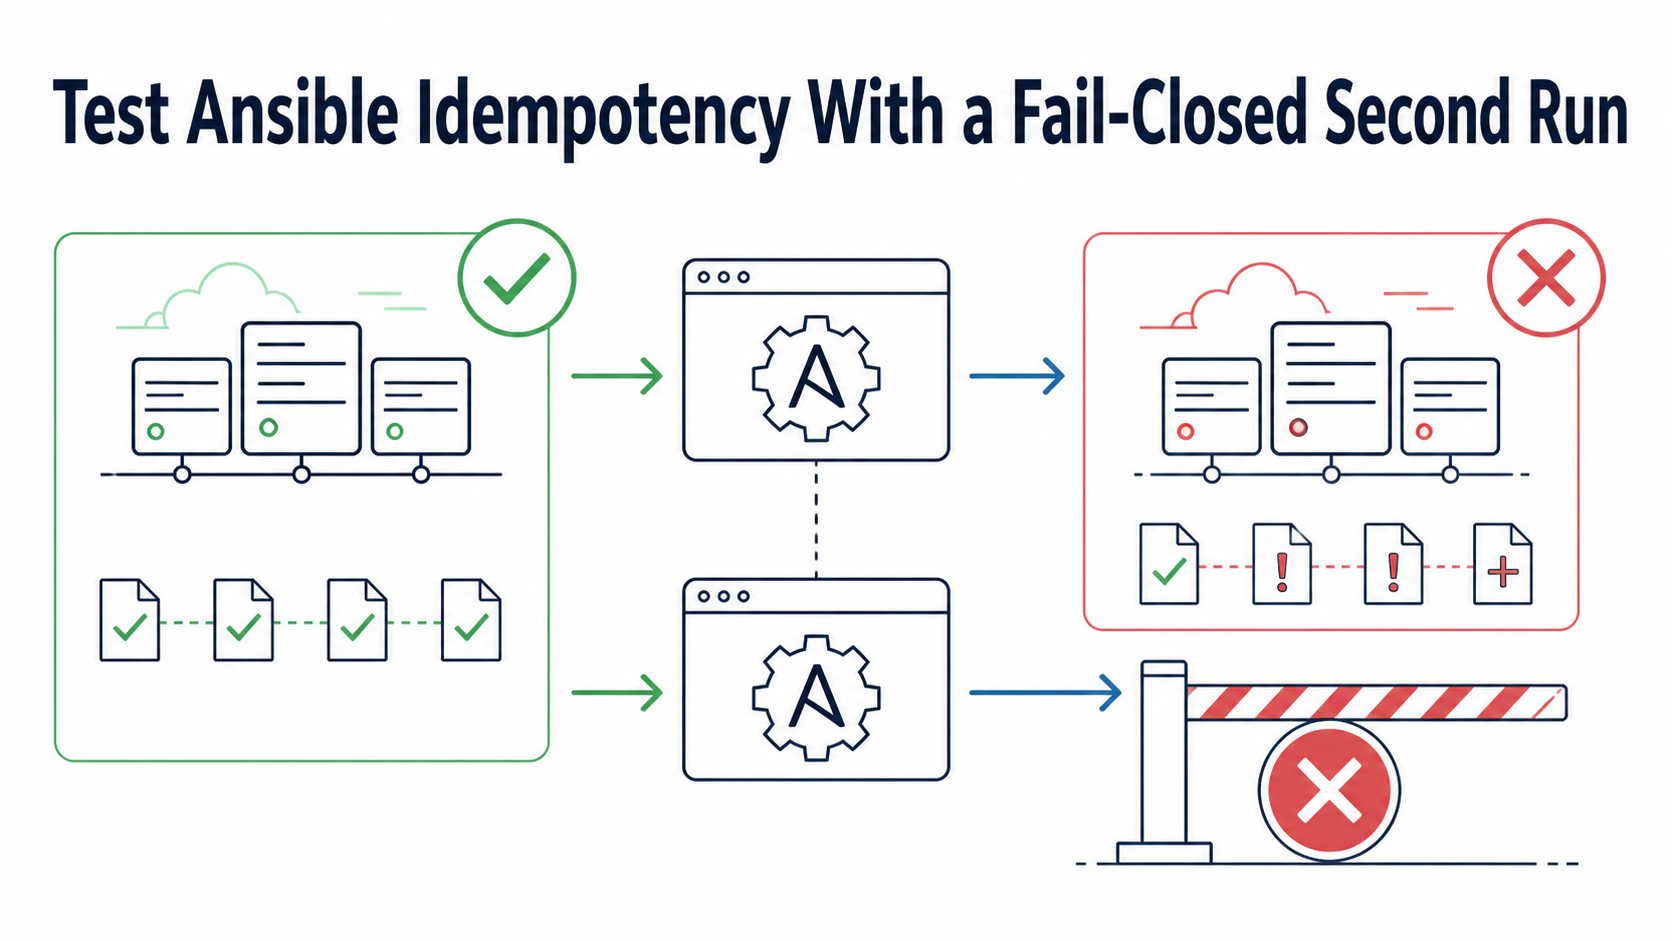
Now evaluate the timelines. A zero exit status means every listed assertion matched; it does not merely mean that the command completed.
set -euo pipefail
LAB=/tmp/voxfor-promtool-rule-test
MARKER="$LAB/.voxfor-promtool-lab"
PROMTOOL="$LAB/root/usr/bin/promtool"
[[ -f "$MARKER" && -x "$PROMTOOL" ]]
cd "$LAB"
"$PROMTOOL" test rules api-alerts.test.yml > pass.out 2>&1
grep -q 'SUCCESS' pass.out
cat pass.out
One observed receipt joins tool identity with all five decisions. Its 3-minute line means “not firing,” while the 4-minute line records the exact firing identity. A unit file does not expose pending as an expected alert, so the later firing assertion is essential; without it, an empty result could also describe a rule that never activates.
tool=2.53.3+ds1
package_sha256=ff27654eacc95abd846d344e91fe4ba3b4f0588a50d606ed1d2f09ad3408722f
syntax=SUCCESS
positive_suite=SUCCESS
pre_for_3m=not_firing
post_for_4m=firing severity=page team=platform instance=api-1
healthy_6m=inactive
negative_control=REJECTED status=1 expected=warning got=page
restored_suite=SUCCESS
cleanup=ABSENT
The alert contract is verified when the rule syntax succeeds, the 10% series has no firing alert at 3 minutes, the same instance fires at 4 minutes with severity=page, team=platform and the rendered summary, the 1% series stays inactive at 6 minutes, a deliberately wrong label exits nonzero, and the restored fixture succeeds again. The reproduced Debian 13 run met every criterion with promtool 2.53.3.
Make Routing Drift Break the Gate
A passing test suite does not prove that its assertions are sensitive. Challenge one central field. The next block copies the valid fixture, changes only the first expected severity from page to warning, and requires a failure. Both expected and actual values must appear in the diagnostic.
set -euo pipefail
LAB=/tmp/voxfor-promtool-rule-test
MARKER="$LAB/.voxfor-promtool-lab"
PROMTOOL="$LAB/root/usr/bin/promtool"
[[ -f "$MARKER" && -x "$PROMTOOL" ]]
cd "$LAB"

cp api-alerts.test.yml api-alerts.bad.test.yml
sed -i '0,/severity: page/s//severity: warning/' api-alerts.bad.test.yml
set +e
"$PROMTOOL" test rules api-alerts.bad.test.yml > negative.out 2>&1
NEGATIVE_STATUS=$?
set -e
[[ $NEGATIVE_STATUS -ne 0 ]]
grep -q 'severity="warning"' negative.out
grep -q 'severity="page"' negative.out
printf 'negative_control=REJECTED status=%s expected=warning got=page\n' \
  "$NEGATIVE_STATUS"
Ivar Prudnikov’s real failure transcript demonstrates why exact expected-versus-got output is valuable: a test can expose label and annotation differences that would otherwise surface only after misrouting. Severity is central here because notification policy commonly routes on it.
Restore the original suite, rather than editing the failed copy until it passes. That preserves the negative artifact and proves the approved file still succeeds.
set -euo pipefail
LAB=/tmp/voxfor-promtool-rule-test
MARKER="$LAB/.voxfor-promtool-lab"
PROMTOOL="$LAB/root/usr/bin/promtool"
[[ -f "$MARKER" && -x "$PROMTOOL" ]]
cd "$LAB"
"$PROMTOOL" test rules api-alerts.test.yml > restored.out 2>&1
grep -q 'SUCCESS' restored.out
printf '%s\n' 'restored_suite=SUCCESS'
Whenever the rule or fixture changes, run the same command in CI. Keep rule files and test files in version control, pin the promtool build, and make any nonzero exit block the merge or release. Avoid rewriting expected outputs automatically from the current rule: that converts regression detection into snapshot approval without review.
Where the Unit Test Ends and Operations Begin
promtool test rules simulates evaluation. It does not prove that service discovery finds a target, exporters expose the intended counters, scrape timestamps arrive on schedule, remote-write preserves labels, Alertmanager groups correctly, or a receiver delivers a notification. Those are integration and production acceptance layers.
Use Prometheus Blackbox Exporter workflow when real HTTP, DNS or TLS reachability must feed the monitoring path. Finish business-critical coverage with customer-journey uptime monitoring so a green component metric is not mistaken for a working checkout, login or form submission.
Synthetic counters also simplify reality. Counter resets, sparse samples and missing status labels can alter rates. Add separate fixtures when those states are plausible and materially affect the alert. Keep each case tied to one reader decision; do not create dozens of permutations that nobody can interpret during review.
Alert thresholds still require production evidence. A 5% ratio and three-minute hold time are lab choices, not universal defaults. Choose them from service objectives, traffic volume, incident history and response capacity. Andrea Di Lisio’s worked alert-duration examples provide useful independent context, but your accepted values must come from your workload.
Before the Rule Ships: Six Questions
What does promtool test rules actually test?
promtool test rules loads rule files, generates declared synthetic series, evaluates rules at fixed times and compares the resulting alerts or PromQL samples with expected values. It can verify firing presence, source and rule labels, expanded annotations and empty firing sets without starting a Prometheus server.
Does an empty exp_alerts list prove an alert is pending?
An empty expected-alert list proves only that the named alert is not firing at that evaluation time, not that it is pending. Pair that pre-boundary assertion with a later exact firing assertion; otherwise the same empty result could come from a false expression, missing input or broken rule.
When should for: 3m start firing in this fixture?
In the reproduced one-minute evaluation fixture, the exact alert first fired at 4 minutes, after the rate expression had enough samples and remained active for the full hold time. Evaluation interval and range-vector behavior affect the boundary, so encode both sides instead of relying on mental arithmetic.
Can promtool verify severity, team and annotation text?
Yes. exp_labels compares the complete expected label set, including labels inherited from the source series and added by the rule. exp_annotations compares rendered annotation values, which lets a release gate catch routing drift and broken operator context.
Is promtool check rules enough before deployment?
Syntax alone is insufficient. check rules validates rule structure, but it does not simulate time-dependent behavior or compare alert output. Run both: syntax first for focused diagnostics, then test rules for thresholds, timing, labels, annotations and negative cases.
Does a passing unit test replace a live notification test?
Live notification still needs a separate test because the unit suite excludes scrape discovery, production data quality, Prometheus-to-Alertmanager transport, grouping, inhibition and receiver delivery. Use the unit suite as the earliest fail-closed gate, then perform proportionate integration and end-to-end checks.
Remove Only the Test Fixture
If any assertion or tool identity is wrong, keep the rule out of Prometheus and leave the existing live configuration unchanged. Review negative.out, correct the source rule or expected contract, rerun the original fixture, and remove only the lab whose exact marker exists. No production alert needs rollback because this workflow never loads one.
set -euo pipefail
LAB=/tmp/voxfor-promtool-rule-test
MARKER="$LAB/.voxfor-promtool-lab"
[[ "$LAB" == /tmp/voxfor-promtool-rule-test ]]
[[ -f "$MARKER" ]]
cd /
find "$LAB" -xdev -mindepth 1 -delete
rmdir "$LAB"
[[ ! -e "$LAB" ]]
printf '%s\n' 'cleanup=ABSENT'
After restored success, cleanup left /tmp/voxfor-promtool-rule-test absent. That final state closes the lab without installing Prometheus, changing a live rule, or leaving synthetic data behind.