Lifetime VPS Europe
 Lifetime VPS Asia
 Lifetime WooCommerce Hosting
 Lifetime Hosting
 Lifetime Game Dedicated Servers
 Chicago, US
 Tokyo, Japan
 Singapore
 Hong Kong
 Seoul, South Korea
 Amsterdem, Netherlands
 London, UK
 Stockholm, Sweden
 Oslo, Norway
 Vienna, Austria
 Zurich, Switzerland
 Sydney, Australia
 Wordpress Hosting
 VPS Hosting
 DDOS Protection
 Submit Ticket
 Full Management
 Guides
 Videos and Podcasts
 Discover Creative Ideas
 Voxfor Autonomous AI Workers
 Voxfor Mega Menu
 Voxfor Advanced Price Management For WooCommerce
 Voxfor Secure Live Chat and AI Support
 Voxfor Multilanguage
 Voxfor AI Content Summary
 Voxfor Autopilot
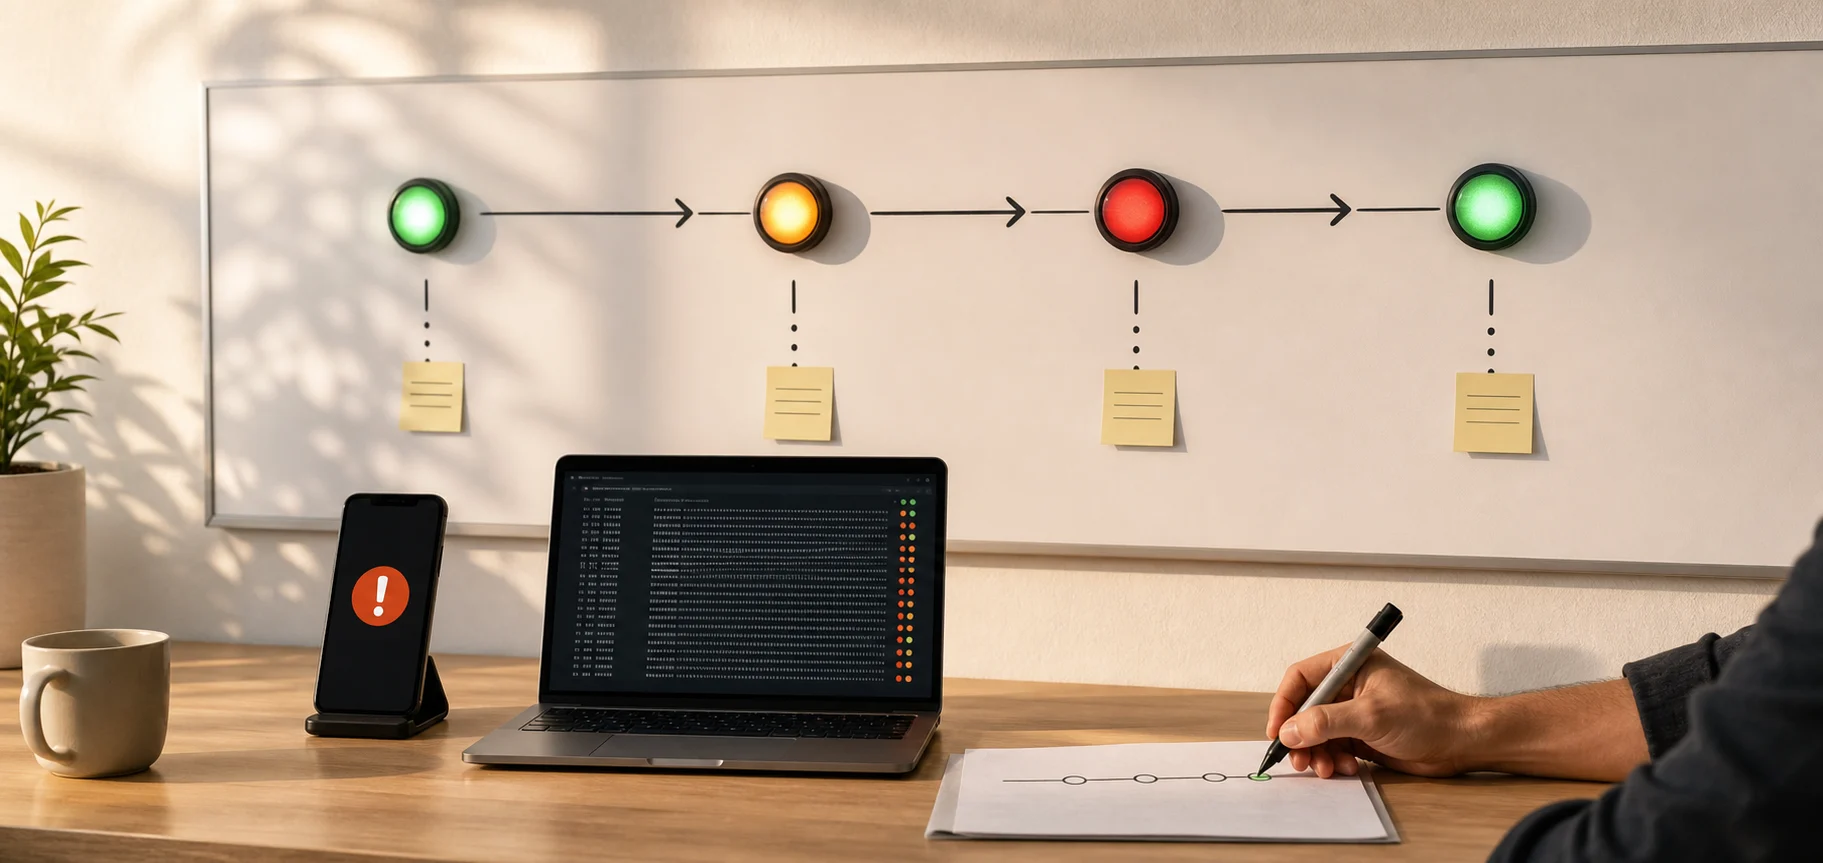
At 02:17, a customer-facing API stops answering. A monitor on the same server disappears with it, so nobody receives the alert. That is the first design problem to solve before installing Uptime Kuma.
For dependable Uptime Kuma VPS monitoring, run the monitor outside the failure it watches, keep port 3001 bound to loopback, and prove that both outage and recovery notifications reach a channel that does not depend on the monitored service. The container is the easy part. Failure separation, private access and a tested alert path are what make the monitor useful.
Build the Monitor Outside the Failure It Watches
Uptime Kuma can check websites, APIs, TCP ports, DNS records, certificates, push jobs and other services. Its official project also supports multiple status pages, 2FA and more than 90 notification integrations. None of that helps during a full VPS outage if Uptime Kuma lives on the same machine.
Choose the failure boundary first:
| Placement | What it can detect | What it can miss | Decision |
|---|---|---|---|
| Same VPS as the application | Process crash, bad HTTP response, some container failures | Full host, power, hypervisor or upstream network failure | Useful only as a secondary local check |
| Separate VPS in the same region | Application-host failure and many network faults | Some shared regional or provider failures | Good starting point for small deployments |
| Separate VPS in another region | Host failure plus more regional routing failures | A monitoring-provider or alert-channel failure | Stronger independent signal |
| External monitor plus self-hosted Uptime Kuma | A second outside perspective | More tools and alert rules to maintain | Appropriate for higher-impact services |
A small team does not need a complex observability platform to apply this rule. It needs a monitor that survives the incident. A Linux VPS for an always-on monitor can fill that role when it is separate from the production workload it checks.
Uptime Kuma 2.5.0 was published on August 1, 2026. The release added an NTP monitor type, expanded notification options and included dependency and monitor fixes. That freshness is useful, but this guide is not a release summary: the deployment boundaries below matter across minor versions.
Deploy Uptime Kuma with a Private Listener
Start from a maintained Ubuntu or Debian VPS with Docker and the Compose plugin. If the machine is new, complete the first-login Linux VPS checklist before adding another service. Confirm SSH access, updates and the active firewall policy first.
Create a dedicated application directory:
sudo install -d -m 0750 -o "$(id -un)" -g "$(id -gn)" /opt/uptime-kuma
cd /opt/uptime-kuma
Use this compose.yaml baseline:
services:
  uptime-kuma:
    image: louislam/uptime-kuma:2
    container_name: uptime-kuma
    restart: unless-stopped
    ports:
      - "127.0.0.1:3001:3001"
    volumes:
      - ./data:/app/data
The important line is 127.0.0.1:3001:3001. Docker otherwise publishes a mapped port on every host interface by default. Loopback binding keeps the raw Uptime Kuma listener off the public network while still allowing a local tunnel or reverse proxy to reach it.
The official Uptime Kuma installation documentation uses the current major image tag and maps persistent data to /app/data. It also warns that NFS is not supported for this application data. Keep the live data on a local filesystem or Docker volume, then copy backups elsewhere instead of running the database directly over NFS.
Bring up the service and inspect it locally:
docker compose pull
docker compose up -d
docker compose ps
curl -I http://127.0.0.1:3001
sudo ss -ltnp | grep '127.0.0.1:3001'
The listener check should show 127.0.0.1:3001, not 0.0.0.0:3001 or [::]:3001. Fix the Compose mapping before continuing if it is reachable on every interface.
If Compose is still unfamiliar, this comparison of Docker Compose on a VPS explains why a versioned file is easier to review and recover than a long one-off docker run command.
Choose a Deliberate Dashboard Access Path
“Not exposed” can mean two different things. A dashboard behind HTTPS and a password is protected, but its login surface is still reachable from the internet. A truly private dashboard is reachable only through a tunnel, VPN or access gateway.
| Access path | Public listener | Best fit | Main caveat |
|---|---|---|---|
| SSH tunnel | None for Uptime Kuma | One or two administrators | Tunnel must be opened when needed |
| Private VPN | VPN endpoint only | Small team with regular access | VPN identity and device access need maintenance |
| HTTPS reverse proxy | Ports 80/443 | Teams needing browser access from many locations | Login surface remains internet-reachable unless another access layer restricts it |
| Public status page | Public web endpoint | Customer communication | Public and admin routes need a deliberate boundary |
For the smallest private setup, open a tunnel from the administrator’s computer:
ssh -N -o ExitOnForwardFailure=yes
  -L 3001:127.0.0.1:3001 [email protected]
Then browse to http://127.0.0.1:3001 locally. Port 3001 stays closed on the server’s public interface.
Complete the first-run setup through this private tunnel before configuring any internet-reachable reverse proxy:
- Create the first Uptime Kuma administrator account.
- Set a strong, unique password stored in the team’s password manager.
- Sign in and enable 2FA for the administrator.
- Confirm the persistent
datadirectory is present and included in the backup plan. - Close the browser and reconnect through the tunnel to prove the new login works.
A fresh instance presents its initial account-creation flow until the first user exists. Publishing the reverse proxy first could allow an unintended visitor to reach that setup screen.
When browser access must be public, terminate HTTPS at a reverse proxy and retain the loopback bind. Uptime Kuma uses WebSockets, so NGINX needs the upgrade headers documented in the official reverse-proxy guide:
server {
    listen 443 ssl http2;
    server_name monitor.example.net;

    location / {
        proxy_pass http://127.0.0.1:3001;
        proxy_http_version 1.1;
        proxy_set_header Upgrade $http_upgrade;
        proxy_set_header Connection "upgrade";
        proxy_set_header Host $host;
        proxy_set_header X-Real-IP $remote_addr;
        proxy_set_header X-Forwarded-For $proxy_add_x_forwarded_for;
        proxy_set_header X-Forwarded-Proto $scheme;
    }
}
Add valid certificates using the site’s established certificate workflow, enable Uptime Kuma 2FA, and avoid treating an obscure hostname as access control. If a public status page and a strictly private admin surface are both mandatory, plan an access gateway or separate instance rather than assuming one public origin hides the login route.
Design Checks Around Failure Questions
Adding every possible monitor creates noise. Start with the customer-visible path, then add checks only when they answer a different failure question.
| Check | Question it answers | Starting policy | Common mistake |
|---|---|---|---|
| HTTPS plus keyword or JSON | Is the service returning the expected result? | 60 seconds, then tune retries | Treating any HTTP 200 as healthy |
| TCP | Is a required port reachable? | 60-120 seconds | Assuming an open port means the application works |
| DNS | Does the name resolve as expected? | 5-10 minutes | Alerting on one transient resolver response |
| Certificate information | Is TLS valid and approaching expiry? | Hourly or longer | Discovering expiry only after users see errors |
| Push monitor | Did a scheduled backup or job report completion? | Longer than the normal job duration | Monitoring the scheduler but not job completion |
| NTP | Is a time source answering? | Based on workload sensitivity | Adding it where clock drift has no operational impact |
For a web application, combine an HTTPS check with a small expected keyword or JSON value. A status code alone can stay green while the page returns a maintenance screen, empty response or application-level error.
Intervals are not a competition. Uptime Kuma supports short checks, but a 20-second interval across many endpoints creates more requests and can amplify brief network noise. Start with a minute for critical customer paths, use retries for transient failures, and lengthen checks that change slowly.
Route Alerts Outside the Monitored Stack
An alert channel shares a failure domain too. Email sent through the same mail server being monitored may never arrive when that server is down. A webhook delivered to an application on the same VPS has the same weakness.
Use at least one notification path outside the monitored workload, such as a third-party email provider, Telegram, Slack, Discord or an external incident system. A second channel is useful when the service has real business impact, but two channels that depend on the same network are not truly independent.
Test the path without stopping production:
- Create a temporary monitor for a harmless test endpoint or an intentionally unused test port.
- Confirm the down notification arrives with the expected monitor name and timestamp.
- Point the monitor at a healthy test endpoint and confirm the recovery notification.
- Record the observed detection time, retry behavior and delivery channel.
- Remove or pause the test monitor after the exercise.
A green dashboard is not proof of alerting. Only a controlled failure proves that the down and recovery routes work.
Reduce False Positives Before Adding More Monitors
False positives teach operators to ignore real alerts. Tune the small set you already have before expanding it.
- Use two or more failed checks before paging for a customer-facing service unless the workload requires immediate notification.
- Set timeouts according to normal application behavior, not an arbitrary low number.
- Separate availability from performance. A slow response may need a warning, while a failed response needs an outage alert.
- Group dependencies. If a shared gateway fails, avoid sending a wall of identical downstream alerts when one parent incident explains them.
- Suppress planned maintenance through the available maintenance workflow instead of accepting predictable noise.
- Keep one outside signal for globally distributed or CDN-fronted services; a single monitoring region sees only one network path.
Uptime Kuma focuses on availability checks and status communication. It does not replace host metrics, centralized logs, traces or application performance monitoring. If the question is “why is CPU saturated?” or “which query became slow?”, add a metrics or log stack rather than forcing an uptime monitor to answer it.
Back Up and Update the Monitoring State
Monitor definitions, history and notification configuration live under /app/data in the container. Back up both the Compose file and that data directory. Because the default small deployment commonly uses a local database, take an application-consistent copy rather than archiving files while they are changing.
For a short planned maintenance window:
cd /opt/uptime-kuma
docker compose stop
sudo tar -C /opt/uptime-kuma
  -czf /var/backups/uptime-kuma-$(date +%F).tar.gz
  compose.yaml data
docker compose start
Copy the archive to protected off-server storage and restrict access; notification settings may contain credentials. Stopping the monitor creates a short visibility gap, so schedule the backup deliberately and use a storage/database-aware method if that gap is unacceptable.
Before an update, take a fresh backup and read the release notes. The official update workflow for Compose is straightforward:
docker compose pull
docker compose up -d --force-recreate
docker compose ps
docker compose logs --tail=100 uptime-kuma
Afterward, sign in, confirm monitors loaded, run one controlled notification test and inspect recent logs. A restore test should use an isolated clone or staging host. Otherwise the restored copy may start duplicate checks and send duplicate notifications.
When Uptime Kuma Fits—and When It Does Not
| Uptime Kuma fits when | Choose more or different tooling when |
|---|---|
| A small team needs clear website, API, port, DNS and certificate checks | You need deep host metrics, log search, traces or APM |
| You want self-hosted notifications and status pages | You need a globally distributed SLA measurement by itself |
| Operators can maintain backups, updates and alert ownership | Nobody owns patching, recovery or notification testing |
| A separate monitoring host can survive application failure | The monitor must live only on the workload it watches |
Self-hosting trades a subscription for operational ownership. If nobody can patch the monitoring host, protect its credentials, test restores or respond to alerts, managed server operations may be a better boundary than another unattended dashboard.
Finish with a Real Failure Test
A useful Uptime Kuma deployment has four verified properties: it survives the failure it watches, its admin listener is not casually exposed, its alerts leave the failed system, and its state can be restored.
Installing the container may take minutes. Proving those four properties takes longer, but that proof is the difference between a dashboard and an operational monitor.
FAQ
Is Uptime Kuma useful on the same VPS it monitors?
Yes, for application and container failures. It is not an independent signal for a full host, hypervisor, power or upstream network failure, so important services need an outside monitor too.
Does binding port 3001 to localhost stop external checks?
No. The binding limits who can open the dashboard listener. Uptime Kuma can still send checks and notifications outward from the container and host.
Can one instance provide a public status page and private admin access?
It can publish status pages, but the public application origin may also expose authenticated admin routes. Use an access gateway, careful proxy policy or a separate instance when strict separation is required.
What should an Uptime Kuma backup contain?
Back up the Compose configuration and the persistent /app/data content, store a protected copy off-server, and test restoration in isolation so the clone does not send duplicate alerts.