
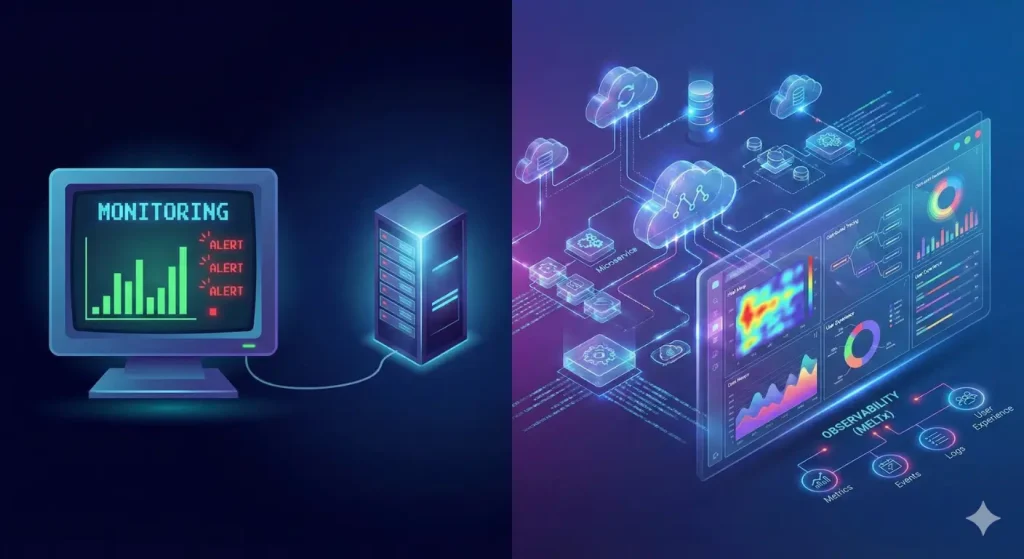
The digital ecosystem in 2026 will not have much in common with the stagnant web of the last 10 years. With organizations moving to distributed microservices, serverlessness, and edge computing, the act of ensuring digital reliability is no longer a checklist but an intricate field of study that has become referred to as Intelligent Observability. In this report, analysis of the web performance monitoring environment of the year 2026 is made, tand he tools, methods, and economical approaches to success are examined that make the year 2026 the epoch of Artificial Intelligence (AI) and data-driven management.
In 2026, it is no longer the perishability of the website that defines whether one invests in IT infrastructure or not, but whether the website can be monitored (is it up), or observable (why is it slow). Although basic uptime checks continue to play a crucial role in small businesses and individual developers, enterprises are becoming more exposed to so-called Agentic AI, autonomous digital systems that are able to detect, diagnose, and remediate incidents without human input, thus reducing the Mean Time to Resolution (MTTR) by an order of magnitude.1 This change, however, brings about new issues of data governance, vendor lock-ins, and a spiraling cost of operation.
This overview-based segmentation includes the following types of market segments: the full-fledged Enterprise Observability Platforms such as Datadog and New Relic, the simplicity and reliability-oriented tools such as UptimeRobot and Better Stack, and the new category of open-source and privacy-oriented platforms. By mapping a step-by-step analysis of pricing schemes, functionality, and user perception, this report will empower the IT decision-makers to overcome the so-called Tax of the Datadog, the potential of the so-called MELTx telemetry, and the creation of robust infrastructures capable of surviving the pressures of the contemporary web.
The tools of 2026 can be comprehended by initially having an idea of the paradigm shift that has taken place in the IT industry. In the past, monitoring was a reactive practice. It included changing fixed limits, like alert me when CPU usage is above 80 percent or ping the server every 5 minutes. This was adequate when dealing with monolithic applications, whereby one server failure was the probable reason for an outage.
However, modern applications are composed of hundreds, sometimes thousands, of ephemeral containers and serverless functions that spin up and down in milliseconds. In such an environment, a traditional monitor might show everything as “green” (healthy) while users are experiencing profound failures due to a latency spike in a third-party API or a database lock. This reality has given rise to Observability.
Observability is not a verb; it is a property of a system. It is a measure of how well the internal state of a system can be inferred from its external outputs. In 2026, these outputs are categorized under the MELTx framework, an evolution of the traditional MELT (Metrics, Events, Logs, Traces) model.
The most significant technological disruptor in the 2026 monitoring landscape is the deployment of Agentic AI. Unlike the generative AI of 2024, which could summarize logs or write basic code, Agentic AI possesses agency, the ability to take action.
Organizations can no longer be satisfied with tools that simply inform them that there is a problem. They require platforms that are capable of fixing it. The self-healing infrastructure is coming true. As an example, an AI agent can automatically spin a new instance, redirect traffic, and restart a failing service automatically when it notices a memory leak in a server application and logs the incident to be reviewed by humans the following morning.
This is a change that is necessitated. The amount of telemetry data produced by contemporary stacks is too large to be filtered by human engineers. RCA is a machine learning-based Automated Root Cause Analysis tool that correlates millions of log lines and metric spikes to identify the exact cause and time of an error, which is essential in the reduction of alert fatigue a phenomenon that occurs when engineers get inured to constant notifications, missing important events.
As the technology has improved, the cost has also improved. The most common business model used to consider enterprise observability is the usage model, in which customers charge purchase per gigabyte of logs consumed and every host observed. These expenses may run out of control as online enterprises expand, and in many cases, they exceed the expansion of the company. This phenomenon is also known as the “Datadog Tax or the Observability Tax.
In 2026, “Budget Resilience” has become a top priority for CIOs. Research indicates that 96% of organizations are maintaining or increasing their observability spend, but dissatisfaction with the Return on Investment (ROI) is growing.10 This has created a bifurcated market: on one side, premium platforms offering deep, AI-driven insights for a high price; on the other, open-source and modular tools offering control and predictability.
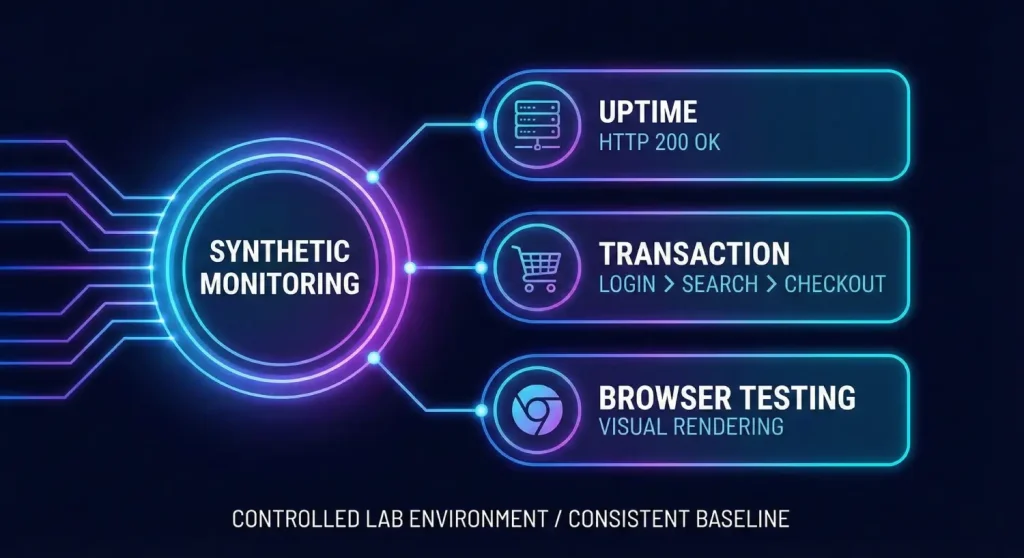
It would be necessary to know the methodologies utilized in the specific tools before analysing them. In 2026, a strong monitoring plan can hardly be established around one approach; it will be a combination of synthetic testing, real user monitoring, and infrastructure monitoring.
Synthetic monitoring is the practice of simulating user interactions to test a system’s availability and performance. It is “active” monitoring because it does not require real users to generate data. It is the baseline “heartbeat” of the internet.
Strategic Value: Synthetic monitoring provides a controlled “lab environment.” Because the tests run from known locations with stable connections, they provide a consistent baseline for performance benchmarking.
In case the lab is synthetic, then the field is Real User Monitoring (RUM). The concept of RUM is to inject a small JavaScript snippet into the webpage code that tracks performance statistics of each and every real visitor.
Strategic Value: RUM is the “source of truth” for user experience. It bridges the gap between technical metrics and business outcomes like conversion rate and bounce rate.
This is the backend view. While RUM tells you that a user is having a slow experience, Infrastructure monitoring tells you why.
In 2026, choosing a monitoring tool is as much a financial decision as a technical one. The “Total Cost of Ownership” (TCO) varies wildly between models.
The future is not just seeing the problem, but fixing it. “Agentic AI” will move from pilot programs to production. We will see the rise of “Level 3” autonomous operations, where the AI executes remediation scripts (like restarting a pod or clearing a cache) without human approval, based on high-confidence patterns.
As computation moves to the edge (Cloudflare Workers, AWS Lambda @ Edge), monitoring must follow. Traditional server monitors are blind to code running on the edge network. New tools will emerge that specialize in distributed, ephemeral edge execution tracing.
Observability is becoming a tool for sustainability. “GreenOps” involves using monitoring data to identify “zombie servers”, infrastructure that is running and consuming electricity but doing no useful work. By shutting these down, companies save money and reduce their carbon footprint, meeting ESG goals.
Vendor lock-in is dissolving. OpenTelemetry (OTEL) has become widely standardized in terms of information collection in the industry. By 2026, it will no longer be a huge re-coding task to switch from Datadog to either New Relic or Signoz: it is just a configuration change in the OTEL collector. This puts the power back into the hands of the buyer, and vendors have to fight to be the best in the quality of their analytics rather than the stickiness of their agents.
A tension between complexity and simplicity, power and cost defines the website performance monitoring landscape of 2026.
For Enterprises, the path lies with platforms like Datadog and Dynatrace, leveraging their AI capabilities to manage the chaos of microservices, provided they implement strict data governance to control costs.
For Mid-Market and SaaS, the “hybrid” approach prevails: using New Relic or Better Stack for deep observability while relying on specialized tools like Hyperping for customer communication.
For SMBs and Startups, the reliability of UptimeRobot coupled with the frontend insights of GTmetrix remains the most prudent, cost-effective strategy.
Ultimately, the best tool is not the one with the most features, but the one that provides the clearest signal amidst the noise, enabling teams to deliver the seamless, instant experiences that the users of 2026 demand.

Hassan Tahir wrote this article, drawing on his experience to clarify WordPress concepts and enhance developer understanding. Through his work, he aims to help both beginners and professionals refine their skills and tackle WordPress projects with greater confidence.


 Lifetime VPS Europe
 Lifetime VPS Asia
 Lifetime Hosting
 France Lifetime Dedicated Servers
 Germany Lifetime dedicated servers
 Lifetime Game Dedicated Servers
 Chicago, US
 Singapore
 Hong Kong
 Seoul, South Korea
 Amsterdem, Netherlands
 London, UK
 Zurich, Switzerland
 Sydney, Australia
 DDOS Protection
 Submit Ticket
 Full Management
 Videos and Podcasts
 Voxfor Advanced Price Management For WooCommerce
 Voxfor AI Content Summary


