The documentation of transactions and rising debt has redefined the process of artificial intelligence infrastructure construction and funding. By 2025, the data center transaction volume hit another high with the hyperscalers scrambling to source physical capacity to power AI workloads. However, the truth of the matter is not about the volume of transactions but the capital structure: the buildout has ceased to be based on balance sheet expenditure and instead on the basis of the private credit structure that is betting on future monetization of AI, a structural shift that has significant risk implications.
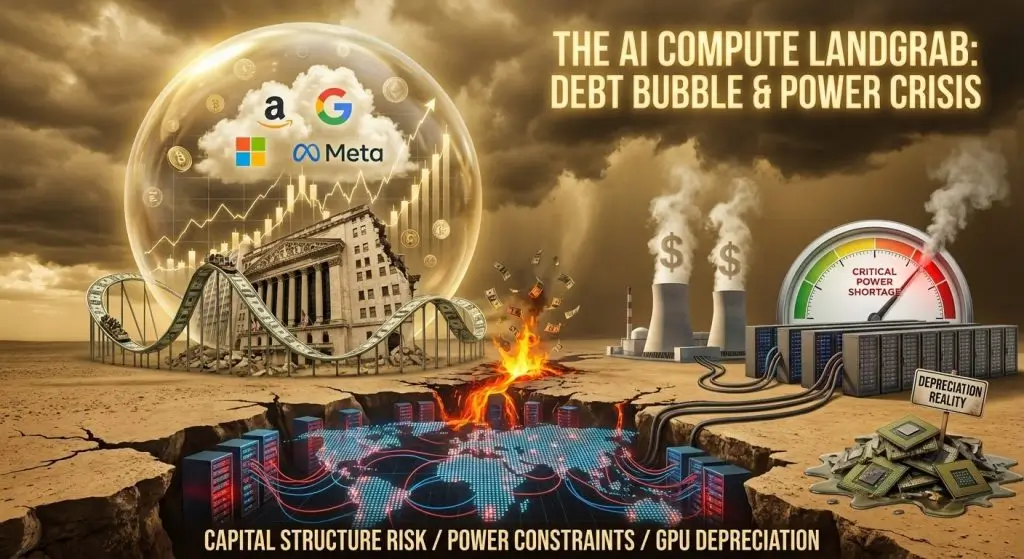
Before examining the surge, it’s critical to separate three overlapping but distinct metrics: deal flow (transaction value), capital expenditure (actual buildout spend), and financing (debt structures). 2025 set records across all metrics. Deal transactions leaped up to the point where investors wanted to gain access points into limited amounts of physical capacity. Hyperscaler Capex hyperscalers (Microsoft, Amazon, Alphabet, Meta) had an average of about $370 billion in capex every year. And debt issuance doubled as cloud providers resorted more and more to project finance funding construction without having to use corporate balance sheet capacity.
It is important to understand the difference between the two: a company can declare record capex but fund it entirely out of current cash flow, or deals can hit records in all three dimensions at once, a unique alignment of actual demand with structural economic pressure pushing hyperscalers to inventive financing. 2025 saw records in all three dimensions simultaneously, an unprecedented alignment, and a sign of how demand is actually strong, as well as structural economic pressures that are compelling hyperscalers to innovation in financing.
Data center dealmaking reached approximately $60+ billion, with deal flow concentrated in the United States. Top markets are “effectively out of space and power,” forcing investors toward tertiary and frontier markets to secure capacity.
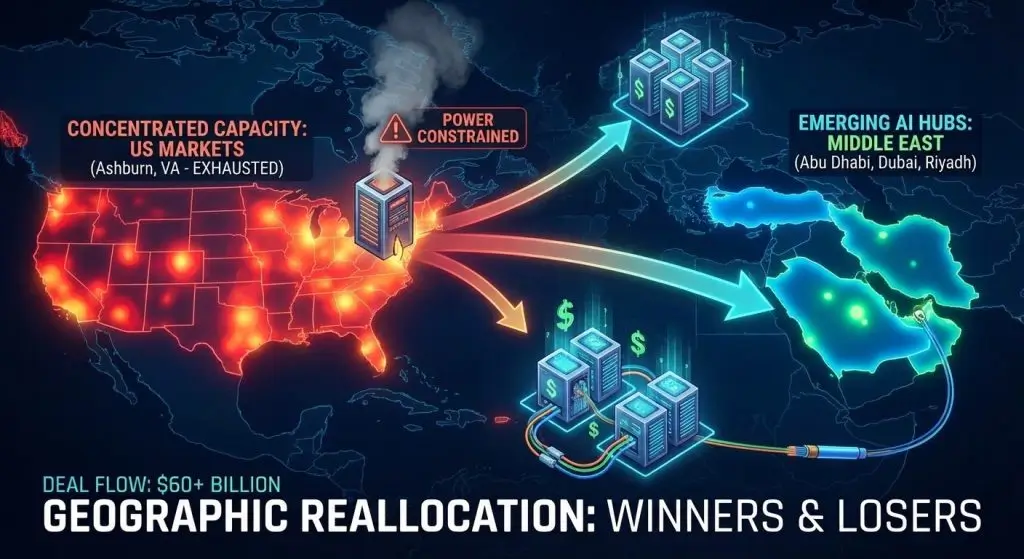
This geographic redistribution provides the tiers of winners and losers: the existing tier-1 interchangeable centre,s such as Ashburn, Virginia, has reached titscapacity and interconnection of power, cooling, and fiber access, and new markets are forced to build whole new infrastructure systems involving power generation, cooling, and fiber access. The Middle East increasingly attracts sovereign wealth funds, positioning their nations as global AI centers, with capital flowing into Abu Dhabi, Dubai, and Riyadh as alternative compute hubs.
The most significant change in 2025 dealmaking lies not in transaction volumes but in financing structure. Debt issuance in the sector surged sharply, with major cloud providers increasingly turning to private equity markets and debt capital rather than financing infrastructure expansion exclusively through corporate balance sheets.
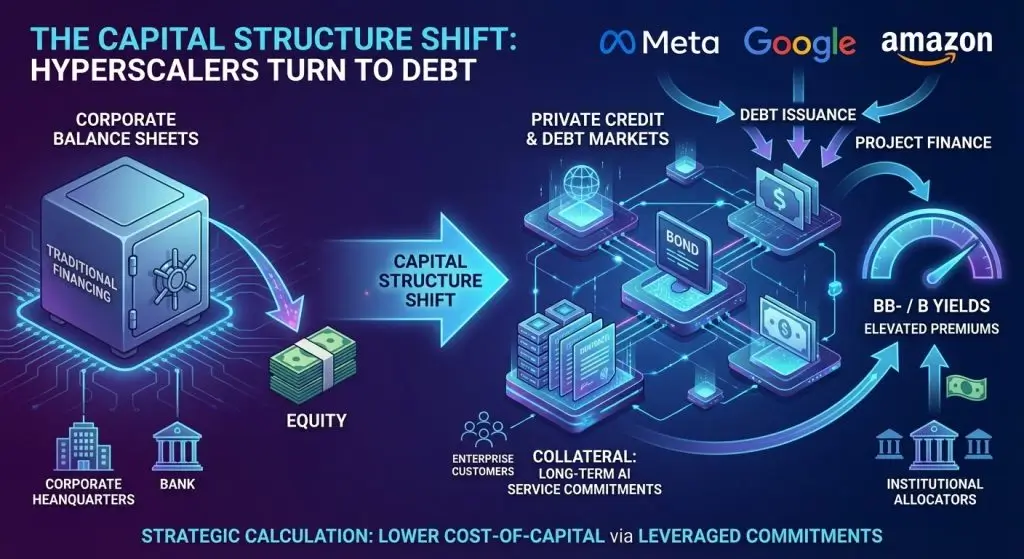
Meta was among the largest debt issuers, raising substantial debt across multiple tranches throughout the year. Google and Amazon similarly issued significant debt tranches. This shift reflects a strategic calculation: cloud providers achieve lower cost-of-capital through credit markets while simultaneously leveraging long-term enterprise commitments to AI services as collateral for financing.
Infrastructure credit now yields BB- to single-B returns, premiums typically unavailable in traditional credit markets. Only approximately 20 infrastructure credit funds target below-investment-grade lending, creating capital scarcity and elevated yield premiums that attract institutional allocators.
Another structural contradiction has arisen in data center funding: hyperscalers are demanding longer-term deals with customers to finance data center expansion by using an enterprise cloud customer as collateral to issue debt. The debt is underwritten against multi-year capacity reservations (effectively take-or-pay), turning customer commitments into the cash-flow backbone supporting the buildout.
This creates an uncomfortable parallel to previous infrastructure bubbles. The structure mirrors telecoms in 2000 and housing in 2008, when infrastructure buildouts ran ahead of sustainable demand, backed by debt seeking yield. The difference between the two is critical in that the cloud customers in the year 2025 are not just users, but they will be included in the collateral to finance the infrastructure. Slow adoption of enterprise AI or longer monetization periods that exceed the customer commitment window kills infrastructure returns and customer viability concurrently.
While deal flow and financing dominate headlines, the actual limiting factor for 2026 expansion is raw power availability. Utilities report difficulty meeting hyperscale requirements, with multi-year delays for grid interconnections slowing development pipelines. Power availability is the primary determinant of where facilities can be built and at what scale.
In high-density regions, power infrastructure is nearing capacity, leading to delays in grid connections and limiting expansion scale. Successful developers lock in power deliverability and streamlined interconnection timelines.
The implication is sobering: deals can be announced, capital may be committed, but when interconnection queues are long, power supply limited, construction schedules become infinite, which does not generate revenues sooner than it services debt.
A critical but underappreciated tension lurks in data center economics: GPU depreciation methodologies may misrepresent true cash generation and asset quality. Hyperscalers employed six-year straight-line depreciation, yet GPU economic utility follows a fundamentally different curve.
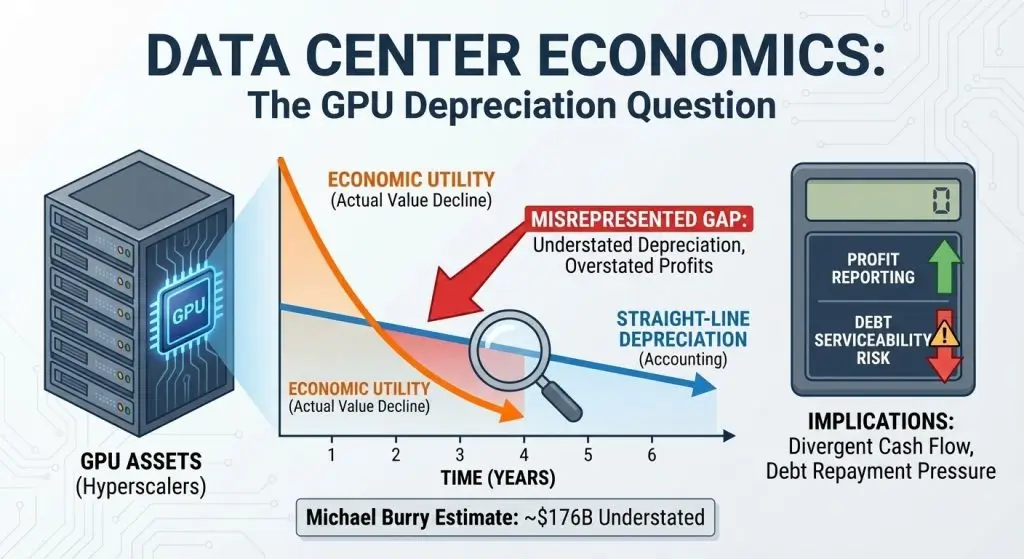
Useful life of GPUs likely compresses to a five-year cycle, as new architectures arrive every 12–18 months, while revenue per GPU falls annually. The economic reality is that GPU value is heavily front-loaded, but straight-line depreciation creates misleadingly smooth accounting, potentially understating depreciation and overstating profits. Michael Burry estimated approximately $176 billion of understated depreciation, suggesting that true operating cash flow may diverge significantly from reported earnings.
This accounting conflict has far-reaching effects on the serviceability of debts. In case the actual depreciation is higher than estimates, operating cash flow might not be adequate to meet the scheduled contemplated debt repayment, and refinancing or selling of assets may be required.
It will be clear whether 2025 record dealmaking is the start of a 15-year infrastructure transformation, or an unsustainable speculation bubble, by applying five key metrics:
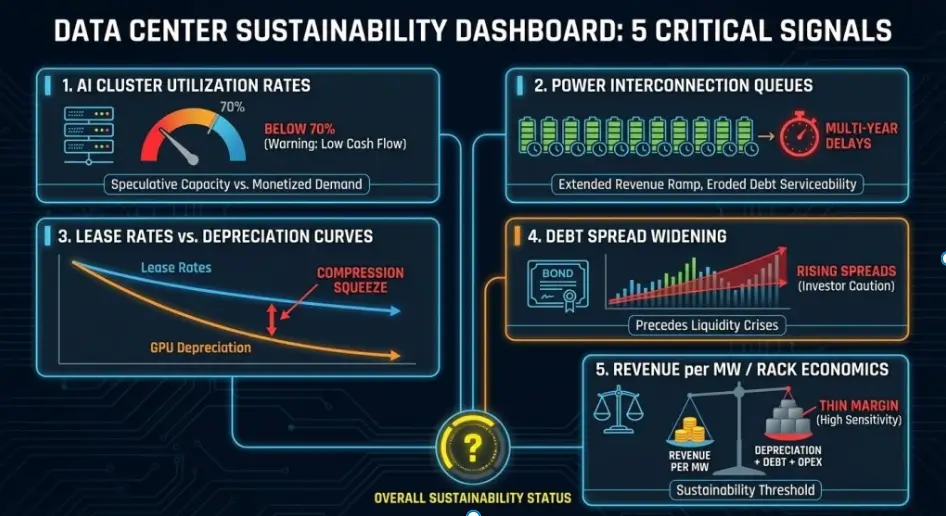
1. AI Cluster Utilization Rates: Early evidence suggests AI infrastructure may operate below full capacity utilization, as hyperscalers build speculative capacity ahead of monetized demand. Published utilization data remains limited, but sustained utilization below 70% would indicate customers are not yet absorbing available capacity, reducing cash flow available to support debt service.
2. Power Interconnection Queue Backlogs: The depth of queues for grid interconnection will determine whether announced capex reaches deployment within planned timelines. Multi-year delays would extend the revenue ramp, eroding debt serviceability without reducing principal obligations.
3. Lease Rates vs. Depreciation Curves: When depreciation cycles of GPU become smaller than the assumptions of the revenue trajectory, the spot compute pricing will decrease sooner than the model predicts. This would decrease the revenue per rack and raise the amount of cash flow going to debt service, which would squeeze the compression.
4. Debt Spread Widening: Rising spreads on data center credit would signal investor caution about future cash flow sufficiency. Watch credit spreads on major hyperscaler debt tranches and specialist data center lending vehicles, widening spreads precede liquidity crises.
5. Revenue per MW / Per Rack Economics: The critical metric underlying sustainability is whether AI workload revenue per unit of compute capacity exceeds the combined depreciation, debt service, and operational costs per unit. Current estimates suggest marginal cash return per MW remains thin, with limited margin for assumption misses.
Record deal flow, surging debt issuance, and geographic expansion represent genuine indicators of enterprise AI demand. The underlying cloud computing market generates substantial revenue, providing a profitable foundation supporting infrastructure investment.
The systemic change to debt-based growth, concentration of customer obligations as security, and the unresolved issues of GPU depreciation, however, make the market on the border of its sustainable growth and speculative bubbles. The power constraints are not simply hypothetical, but nowadays they are the key bottleneck with reference to the real deployment schedules. It is still uncertain whether the record dealmaking of 2025 will be a multi-decade infrastructure transformation or a bubble of unsustainable debt, depending on whether AI monetization timelines of enterprises are reduced to fit the structure of infrastructure financing. The five signals given above will tell you the answer in a much more straightforward way than any amount of headline transactions.

Netanel Siboni is a technology leader specializing in AI, cloud, and virtualization. As the founder of Voxfor, he has guided hundreds of projects in hosting, SaaS, and e-commerce with proven results. Connect with Netanel Siboni on LinkedIn to learn more or collaborate on future project.


 Lifetime VPS Europe
 Lifetime VPS Asia
 Lifetime Hosting
 France Lifetime Dedicated Servers
 Germany Lifetime dedicated servers
 Lifetime Game Dedicated Servers
 Chicago, US
 Singapore
 Hong Kong
 Seoul, South Korea
 Amsterdem, Netherlands
 London, UK
 Zurich, Switzerland
 Sydney, Australia
 DDOS Protection
 Submit Ticket
 Full Management
 Videos and Podcasts
 Voxfor Advanced Price Management For WooCommerce
 Voxfor AI Content Summary


