
- Lifetime Solutions
VPS SSD:
Lifetime Hosting:
DEDICATED SERVERS:
- VPS Locations
- Managed Services
- Support
- WP Plugins
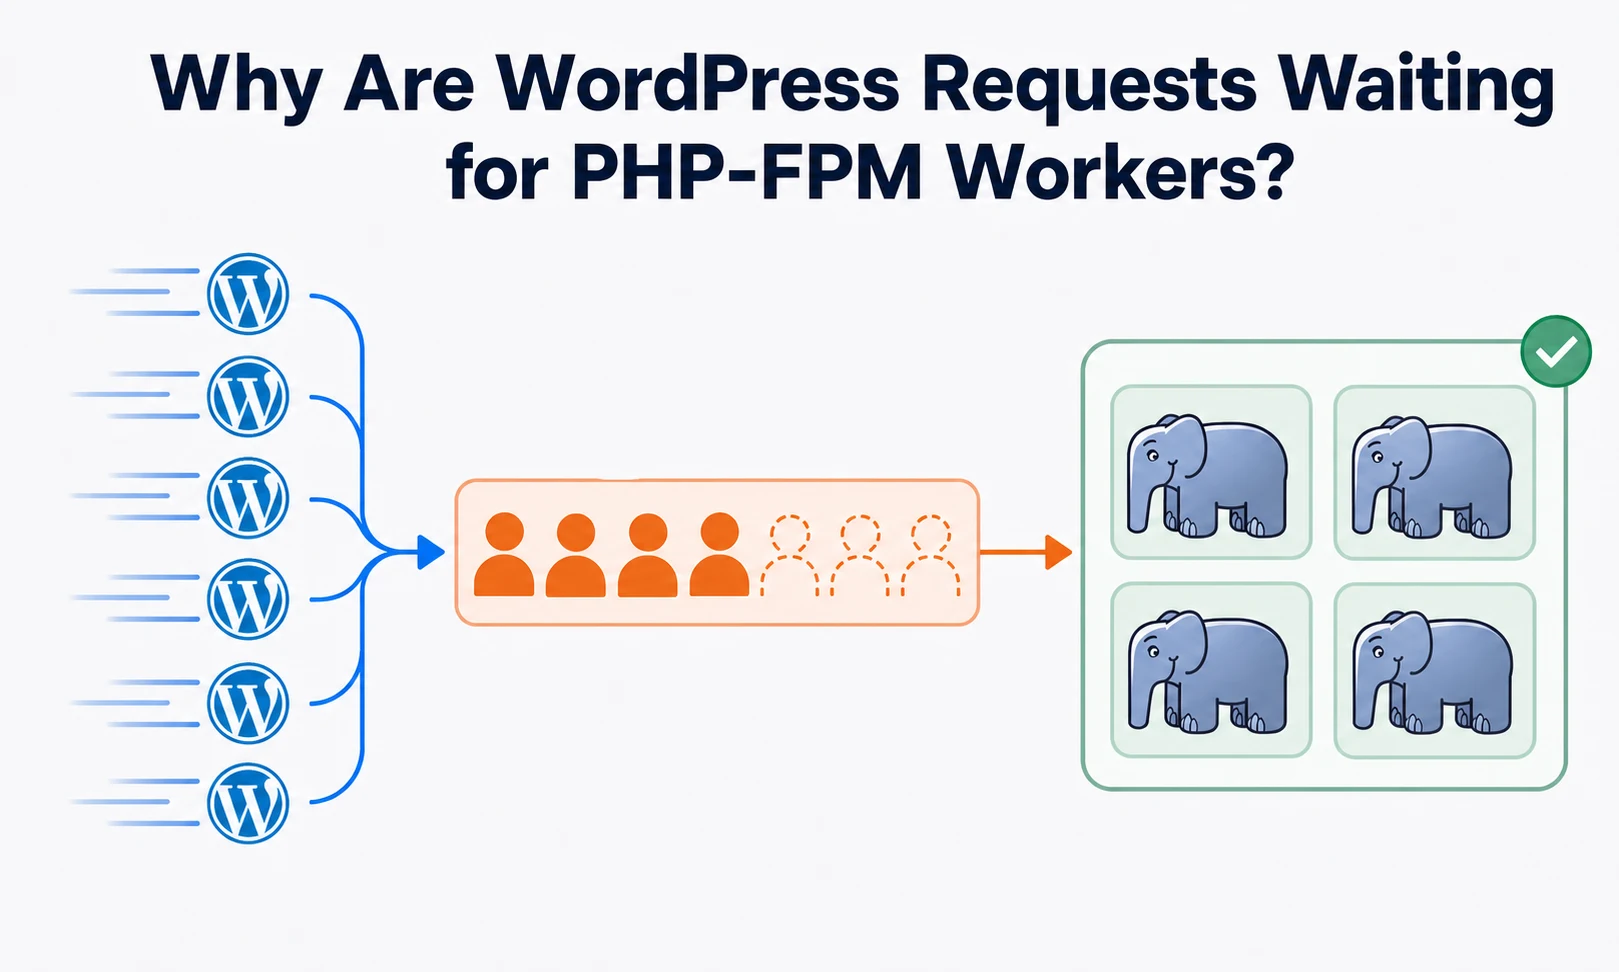
server reached pm.max_children means a PHP-FPM pool used every permitted child process at least once. It does not prove that the limit is too small. During an active WordPress slowdown, confirm a nonzero listen queue and no idle workers, then use the slow log and request timing to learn what is holding each worker. Raise concurrency only when measured memory and CPU headroom can carry it; otherwise a larger pool turns waiting requests into host-wide contention.
During one busy window, a WooCommerce checkout can wait on a payment API, an admin request can run a report, WP-Cron can start background work, and uncached traffic can arrive at the same time. PHP-FPM serves those simultaneous dynamic requests rather than counting visitors; every occupied child remains unavailable until its current PHP request returns.
When PHP-FPM is only one possible suspect, first diagnose WordPress 504 errors by layer so a CDN, reverse proxy, database or remote service is not mistaken for pool capacity. The workflow below begins after FPM has become a credible owner.
PHP’s official FPM pool configuration manual defines pm.max_children as the limit on simultaneous requests served by a pool. A warning records that the ceiling was reached, while the status page reveals whether users are waiting now. Current queue depth, idle workers and active workers must be read together.
Package names and file paths vary across Ubuntu, Debian, RHEL derivatives, cPanel and Plesk. Start from the running master process and service configuration instead of copying a path from another server.
ps -eo pid,ppid,cmd --sort=ppid | grep '[p]hp-fpm'Record the PHP version, pool name, socket or TCP listener, and the configuration file loaded by the active service. On a multi-site host, one domain may have its own pool; changing a global file can affect unrelated tenants while leaving the saturated pool untouched.
Before any edit, copy the effective pool file to a timestamped protected backup and note the current service state. A control panel may regenerate managed pool files, so use its supported configuration surface when it owns the file.
PHP-FPM can publish brief, full, JSON and OpenMetrics status. The official status-page documentation warns that output may reveal request URLs and resource information. Never expose it as an unrestricted public WordPress URL. Bind or route it for localhost, a private monitoring network or an authenticated administrative path.
An article cannot safely provide one universal web-server stanza because FastCGI sockets, access controls and virtual-host layouts differ. The pool-side intent is still clear:
pm.status_path = /fpm-status
; Optional on supported PHP-FPM builds: a separate status listener can remain responsive when the main pool is busy.
; pm.status_listen = 127.0.0.1:9001
After applying the matching local web-server rule, query the endpoint from an allowed host. JSON makes snapshots easier to compare:
curl --fail --silent --show-error 'http://127.0.0.1/fpm-status?json'listen queue > 0 means requests are waiting for a free process. idle processes = 0 shows there is no immediate spare capacity. max children reached is cumulative since the pool started, so a value above zero without a current queue may describe an earlier burst rather than today’s incident. Pool counters reset when FPM restarts; save the snapshot before a reload erases that history.
Match the FPM snapshot with a timestamped user action and web-server error log. Static assets succeeding while several unrelated dynamic endpoints stall strengthens the pool hypothesis. One slow URL with idle workers points toward that request path instead.
Evidence label: queueing is the symptom, not yet the cause. The cause may be more legitimate concurrency than the pool was designed for, long worker hold time, database or network waits, CPU starvation, memory pressure, bot traffic, or scheduled work colliding with users.
Changing pm.max_children before identifying worker hold time removes the best diagnostic signal. PHP’s documented FPM slowlog and access-log directives can capture a backtrace after request_slowlog_timeout, request duration and peak allocated memory.
Choose a threshold below the user-visible timeout but above normal dynamic latency for this site. A five-second example may fit a store whose normal PHP work finishes below one second, yet it would be noisy for a legitimate import pool. Use measured baselines rather than treating the example as a recommendation.
request_slowlog_timeout = 5s
request_slowlog_trace_depth = 20
slowlog = /var/log/php-fpm/wordpress-slow.log
Create the log with ownership and permissions appropriate for the FPM master, validate configuration, then reload through the distribution or panel’s supported method. Keep the capture short enough to limit sensitive path data and log growth. Do not enable public WP_DEBUG_DISPLAY; WordPress debugging documentation recommends staging or a backup before changes and warns against production debug use.
When a trace appears, preserve its timestamp, script, request URI from nearby access evidence, and the deepest meaningful plugin/theme/core frame. One stack is a lead, not a verdict. Repeated traces from the same operation during the queue window establish ownership more convincingly.
| Repeated evidence | Likely hold-time owner | Next proof before changing capacity |
|---|---|---|
| Same plugin callback around remote HTTP functions | Slow or unavailable external API | Provider timing, application timeout and retry behavior |
| Database call or query layer dominates traces | Lock, slow query or overloaded database | Slow-query evidence and database wait state |
wp-cron.php, import or queue runner repeats |
Background work collides with foreground traffic | Scheduled-event timing and job duration |
| Many anonymous front-controller requests | Uncached traffic or bot demand | Cache status, request rate and source distribution |
| Different requests all advance slowly | CPU, storage or host contention | Run queue, CPU steal, I/O latency and memory pressure |
WP-CLI documents a read-only listing command for scheduled events:
wp cron event list --fields=hook,next_run_gmt,next_run_relative,recurrence --format=tableDo not delete events merely because they appear near an incident. First prove that a hook ran, occupied workers and belongs to a plugin or operational process. For WooCommerce, continue with Scheduled Actions backlog diagnosis to inspect queue age and runner ownership because WP-Cron alone does not describe every queued task.
A browser timeout does not prove that payment capture, order creation or stock work failed. Before retrying a checkout or manually creating an order, reconcile the gateway transaction, webhook, WooCommerce order notes and application logs. Continue with WooCommerce payment-processing recovery for transaction-level next steps. Recovery must not create duplicate charges or inventory movement.
This correctness boundary is separate from PHP tuning. A larger worker pool may improve future admission, but it cannot decide what happened to an already uncertain request.
server reached pm.max_children mean?The PHP-FPM message means a pool reached its configured simultaneous-child limit at least once since startup. Confirm current saturation with a nonzero listen queue, zero idle processes and matching request symptoms before changing the value.
Query a restricted FPM status endpoint during the slowdown. Current saturation is supported when requests are in listen queue, all available children are active and idle processes is zero; a historical counter alone is insufficient.
No. Full status can reveal request URLs and resource details, so PHP’s manual says to restrict it to internal requests or known client IPs. Use localhost, private monitoring access or another authenticated administrative boundary.
pm.max_children whenever WordPress returns 504?Not automatically. A 504 can originate at several layers, and more children can exhaust RAM or CPU. Prove the FPM queue, identify worker hold time and calculate host headroom before testing a bounded increase.
A slow log records a PHP backtrace after a request exceeds the configured threshold. Repeated traces can identify a plugin callback, database wait, remote API, cron task or other code path that keeps workers occupied.
Full-page caching can remove many anonymous page views from PHP, reducing dynamic arrival rate. Checkout, account, admin, REST, AJAX, webhooks and background jobs may still reach PHP-FPM, so validate the actual uncached request mix. When traces show repeated database work, Redis cache for WordPress and WooCommerce may shorten worker hold time, but it does not make uncached routes bypass PHP.
Reconcile payment-provider state, webhooks, order notes and stock changes before retrying. The failed browser response does not establish whether server-side transaction work completed.
Two independent budgets constrain PHP-FPM: how many workers the workload needs and how many the host can safely carry. The lower defensible value wins.
For a stable planning window, estimated busy workers are approximately:
dynamic PHP requests per second × average worker hold seconds
At two dynamic requests per second and five seconds of average hold time, roughly ten workers remain busy before adding burst headroom. Shorten hold time to one second and the same arrival rate needs about two busy workers. This is a planning relationship, not a queue guarantee; bursts and a long latency tail still need measured allowance.
The chart’s 20-worker boundary is deliberately an example. A real site substitutes its measured request rate, duration distribution and target headroom. Count only requests that reach PHP: a cache hit served at the edge or web server does not occupy an FPM child.
Measure resident memory during representative traffic rather than immediately after an idle restart. Separate the FPM master from pool children and inspect the distribution; an average can hide large checkout, import or image-processing workers.
ps -C php-fpm -o pid,ppid,rss,etimes,cmd --sort=-rssBinary/service names differ, so adapt the selector after confirming the running process. Use a conservative high-percentile worker RSS, then reserve memory for the kernel, web server, database, cache, monitoring, filesystem activity and workload bursts.
memory-bounded children ≈ memory safely reserved for this pool ÷ representative worker RSS
Do not allocate every apparently free byte. Linux page cache is useful, shared memory complicates per-process RSS addition, and a larger pool also increases database connections and CPU competition. Swap growth, OOM evidence or a saturated run queue blocks an increase even when the warning persists.
When the queue grows while CPU and memory have headroom and request duration is already acceptable, the pool may be under-sized. When a few slow operations dominate traces, repair or isolate those operations first. When anonymous dynamic volume drives demand, caching or request control reduces arrival rate. When the host is already constrained, more workers only admit more contention; workload reduction or a larger environment is the honest boundary.
When the team cannot own pool sizing, private metrics or resource isolation, assign that operational responsibility explicitly. Managed capacity still cannot compensate for an unmeasured request path or an uncontrolled retry loop.
Never combine a child-limit increase, PHP upgrade, plugin update, cache change and database tuning in one acceptance window. One change preserves attribution and makes rollback meaningful.
Record the old pool value and backup path. Use the PHP-FPM binary’s configuration test provided by the installed package or the control panel’s validation action; binary names and flags can differ by version and vendor. A failed test means do not reload.
After validation, apply the supported graceful reload. Confirm the expected master/pool is running, the status endpoint returns, and the effective process-manager values match the approved change. Avoid a blind hard restart during peak traffic because it discards live workers and resets the very counters needed for comparison.
Rollback restores the backed-up pool file through the same owner, validates it, reloads gracefully and confirms the prior effective value. Trigger rollback when memory reserve falls below the approved floor, swap activity appears, CPU queueing materially worsens, error rate increases or latency misses the acceptance target.
Use a representative mix of cache misses, admin/API work and the business action that previously stalled. Synthetic load must remain bounded and authorized. During the window, collect:
Keep the higher child limit only if the queue clears without moving failure into memory, CPU, database or application correctness. A zero queue created by aborting requests or timing them out sooner is not recovery.
Keep one representative observation window after the change. Record the peak listen queue, a high-percentile dynamic-request duration and the minimum host memory reserve. Those three numbers describe admission, hold time and resource safety.
The result is defensible when queue depth returns to zero between bursts, slow-request ownership is repaired or bounded, and host reserve stays above its rollback floor. Add a workload-level proof for the original user action and keep the private status/slowlog controls documented for the next event.
If only pm.max_children improved, the job is unfinished. A durable WordPress recovery explains why workers were occupied, why the chosen concurrency fits the host, and which signal will warn before users become the queue again.




 Lifetime VPS Europe
 Lifetime VPS Asia
 Lifetime WooCommerce Hosting
 Lifetime Hosting
 Lifetime Game Dedicated Servers
 Chicago, US
 Tokyo, Japan
 Singapore
 Hong Kong
 Seoul, South Korea
 Amsterdem, Netherlands
 London, UK
 Stockholm, Sweden
 Oslo, Norway
 Vienna, Austria
 Zurich, Switzerland
 Sydney, Australia
 Wordpress Hosting
 VPS Hosting
 DDOS Protection
 Submit Ticket
 Full Management
 Guides
 Videos and Podcasts
 Discover Creative Ideas
 Voxfor Autonomous AI Workers
 Voxfor Mega Menu
 Voxfor Advanced Price Management For WooCommerce
 Voxfor Secure Live Chat and AI Support
 Voxfor Multilanguage
 Voxfor AI Content Summary
 Voxfor Autopilot