Lifetime VPS Europe
 Lifetime VPS Asia
 Lifetime WooCommerce Hosting
 Lifetime Hosting
 Lifetime Game Dedicated Servers
 Chicago, US
 Tokyo, Japan
 Singapore
 Hong Kong
 Seoul, South Korea
 Amsterdem, Netherlands
 London, UK
 Stockholm, Sweden
 Oslo, Norway
 Vienna, Austria
 Zurich, Switzerland
 Sydney, Australia
 Wordpress Hosting
 VPS Hosting
 DDOS Protection
 Submit Ticket
 Full Management
 Guides
 Videos and Podcasts
 Discover Creative Ideas
 Voxfor Autonomous AI Workers
 Voxfor Mega Menu
 Voxfor Advanced Price Management For WooCommerce
 Voxfor Secure Live Chat and AI Support
 Voxfor Multilanguage
 Voxfor AI Content Summary
 Voxfor Autopilot
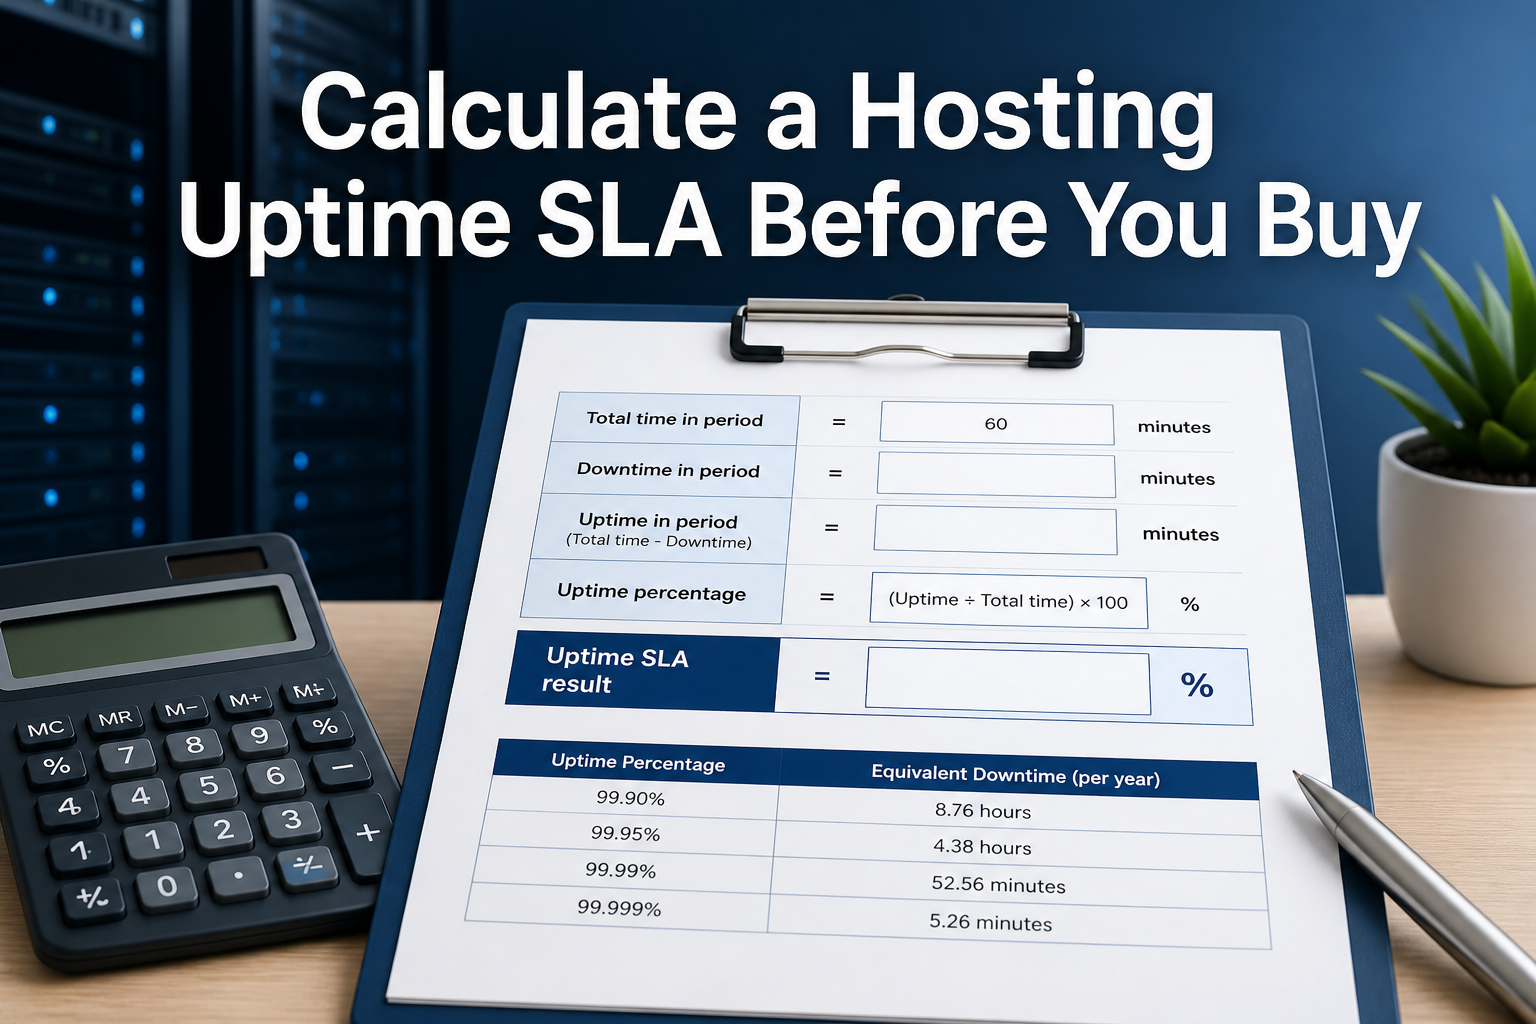
A hosting uptime SLA becomes useful only after the percentage has a time window, a definition of good service, a measurement owner, exclusions, and a remedy. Without those terms, 99.9% is a headline. It does not tell a buyer whether a slow checkout counts, whether scheduled maintenance disappears from the calculation, who decides when an outage began, or what happens after a breach.
Start with the arithmetic: allowed downtime equals the number of seconds in the contract period multiplied by the unavailability fraction. For a 99.9% target, that fraction is 0.001. August 2026 contains 2,678,400 seconds, so a 99.9% monthly SLA leaves 2,678 seconds—44 minutes 38 seconds—after rounding to the nearest second. A 99.99% promise leaves only 268 seconds in the same 31-day month.
The calculation is necessary, but it is not sufficient. This guide reproduces a twenty-probe loopback fixture, separates HTTP 2xx availability from a stricter user-good latency definition, preserves both raw and exclusion-adjusted results, and proves how a discrete monitor can miss an outage between checks. The sample is deliberately small and synthetic: it teaches an auditable method, not the reliability of any hosting provider.
A Percentage Is Not the Contract
An SLA, or service level agreement, is an external commitment with defined remedies. An SLO, or service level objective, is an internal reliability target used to guide engineering and operational decisions. Both may use the same percentage, but the agreement decides what a buyer can claim.
Google’s availability table shows the familiar relationship between nines and downtime, while its SLO implementation guidance recommends expressing a service-level indicator as good events divided by total events. That numerator-and-denominator model is more useful than server process uptime when a service can return an error page, serve only some users, or respond too slowly to complete the intended journey.
For a website, one defensible good event might be “the checkout endpoint returned the expected content with a 2xx status in under 500 ms from an external region.” Another contract may define only external network connectivity. Neither is automatically correct for every workload. The buyer must know which user action and which boundary the percentage covers.
This distinction also prevents responsibility from drifting. Domain registration, authoritative DNS, application code and hosting infrastructure can fail independently. Use domain and hosting ownership guidance to assign those layers before a provider and customer argue about whose outage it was.
Use the Actual Calendar Window
Many calculators use a 30-day month or an average of 365.25 days divided by 12. Those approximations are useful for comparison, but an SLA credit can depend on the real calendar month. February, April and August do not have the same denominator.
The exact formula is:
allowed downtime seconds = period seconds × (1 − SLA percentage / 100)
For August 2026, rounding only the final result to the nearest second produces:
| Monthly SLA | Period seconds | Allowed downtime | Human-readable budget |
|---|---|---|---|
| 99.9% | 2,678,400 | 2,678 seconds | 44 min 38 sec |
| 99.95% | 2,678,400 | 1,339 seconds | 22 min 19 sec |
| 99.99% | 2,678,400 | 268 seconds | 4 min 28 sec |
InMotion Hosting’s current business-oriented SLA explanation is strong because it connects the nines to contract exclusions, claims and the limited value of credits. The extra step here is to retain the exact period used for each calculation. A provider using a calendar month, rolling 30 days, billing month or annual window can report a different result from the same outage history without making an arithmetic error.
Window choice also changes risk. A yearly 99.9% agreement can tolerate one outage near eight hours 46 minutes if the rest of the year is clean. A monthly 99.9% agreement cannot carry unused reliability from eleven clean months into a long incident in the twelfth.
Availability budgets also say nothing about recovery speed or acceptable data loss. Set testable RTO and RPO targets for failures whose impact continues after the service becomes reachable again.
Reproduce the Numerator and Denominator
Run this fixture only in an authorized disposable Linux shell with kernel 5.3 or newer, Python 3.9 or newer, and curl. It binds to loopback port 18765, writes under one exact marker-guarded path, returns 503 for probes 7 and 18, and delays probe 12 by 250 ms. The fixture never contacts a production site.
set -euo pipefail
LAB=/var/tmp/voxfor-hosting-sla-lab-124
PORT=18765

if [[ -e "$LAB" ]]; then
  [[ -f "$LAB/.voxfor-hosting-sla-lab" ]]
  printf 'Refusing to reuse marked lab without review: %s\n' "$LAB" >&2
  exit 2
fi
install -d -m 0700 "$LAB"
printf 'voxfor-hosting-sla-lab-v1\n' > "$LAB/.voxfor-hosting-sla-lab"

cat > "$LAB/server.py" <<'PY'
from http.server import BaseHTTPRequestHandler, ThreadingHTTPServer
from pathlib import Path
import os, time
state = Path(os.environ["SLA_STATE"])
class Handler(BaseHTTPRequestHandler):
    def do_GET(self):
        if self.path != "/checkout-health":
            self.send_response(404); self.end_headers(); return
        n = (int(state.read_text().strip()) if state.exists() else 0) + 1
        state.write_text(f"{n}\n")
        if n == 12: time.sleep(0.25)
        status = 503 if n in {7, 18} else 200
        body = b"healthy\n" if status == 200 else b"unavailable\n"
        self.send_response(status)
        self.send_header("Content-Type", "text/plain")
        self.send_header("Content-Length", str(len(body)))
        self.end_headers(); self.wfile.write(body)
    def log_message(self, fmt, *args): pass
ThreadingHTTPServer(("127.0.0.1", 18765), Handler).serve_forever()
PY

SLA_STATE="$LAB/state" python3 "$LAB/server.py" >"$LAB/server.log" 2>&1 &
pid=$!
printf '%s\n' "$pid" > "$LAB/server.pid"
awk '{print $22}' "/proc/$pid/stat" > "$LAB/server.start_ticks"
for _ in $(seq 1 50); do
  code=$(curl -sS -o /dev/null -w '%{http_code}' \
    "http://127.0.0.1:$PORT/not-a-probe" 2>/dev/null || true)
  [[ "$code" == 404 ]] && break
  sleep 0.1
done
[[ "$code" == 404 ]]
Collect all observations before classifying any of them. The CSV keeps the probe number, UTC timestamp, HTTP status and measured duration. Production monitoring needs independent external locations; loopback here removes internet variability so the policy difference remains deterministic.
[[ -f "$LAB/.voxfor-hosting-sla-lab" ]]
printf 'probe,checked_at_utc,http_code,time_total_seconds\n' > "$LAB/probes.csv"
for probe in $(seq 1 20); do
  checked_at=$(date -u +%Y-%m-%dT%H:%M:%SZ)
  result=$(curl --silent --show-error --output /dev/null \
    --write-out '%{http_code},%{time_total}' --max-time 2 \
    "http://127.0.0.1:$PORT/checkout-health")
  printf '%s,%s,%s\n' "$probe" "$checked_at" "$result" >> "$LAB/probes.csv"
done
[[ $(wc -l < "$LAB/probes.csv") -eq 21 ]]
The timestamp matters even when the contract eventually groups checks into incidents. Keep it in UTC, preserve the original sample and make later incident aggregation reproducible. A dashboard percentage without raw observations is difficult to audit after the provider or monitor changes its state rules.
Count User-Good Events, Not Just Responses
HTTP availability and usable availability answer different questions. The fixture returned 2xx for 18 of 20 probes, or 90%. Once the declared good-event rule also requires completion under 150 ms, the delayed twelfth response becomes bad and the result falls to 17 of 20, or 85%.
import csv, json
from pathlib import Path
root = Path("/var/tmp/voxfor-hosting-sla-lab-124")
rows = list(csv.DictReader((root / "probes.csv").open()))
http_good = [r for r in rows if 200 <= int(r["http_code"]) < 300]
user_good = [r for r in http_good if float(r["time_total_seconds"]) < 0.150]
result = {
    "total_probes": len(rows),
    "http_2xx": len(http_good),
    "http_availability_percent": round(100 * len(http_good) / len(rows), 4),
    "good_under_150ms": len(user_good),
    "user_sli_percent": round(100 * len(user_good) / len(rows), 4),
    "failed_probe_ids": [int(r["probe"]) for r in rows if r not in user_good],
}
(root / "analysis.json").write_text(json.dumps(result, indent=2) + "\n")
print(json.dumps(result, indent=2))
Do not copy the 150 ms threshold into a live SLA. It exists only to prove that the good-event definition changes the numerator. A store might test checkout completion, an API might require a particular response body, and a content site might use a slower but still acceptable latency threshold. Follow website uptime monitoring workflow guidance to build checks around customer-visible journeys rather than treating any TCP connection as a saleable outcome.
Calculate the contract budgets separately from probe outcomes. Keeping arithmetic in its own artifact prevents a twenty-probe teaching sample from being confused with one month of evidence.
from decimal import Decimal, ROUND_HALF_UP
import calendar, json
from pathlib import Path
root = Path("/var/tmp/voxfor-hosting-sla-lab-124")
year, month = 2026, 8
period_seconds = Decimal(calendar.monthrange(year, month)[1] * 86400)
budgets = []
for target in map(Decimal, ("99.9", "99.95", "99.99")):
    allowed = (period_seconds * (Decimal("1") - target / 100)).quantize(
        Decimal("1"), rounding=ROUND_HALF_UP)
    budgets.append({"target_percent": str(target),
                    "allowed_downtime_seconds": int(allowed)})
receipt = {"calendar_window": "2026-08",
           "period_seconds": int(period_seconds), "budgets": budgets}
(root / "calendar-budgets.json").write_text(json.dumps(receipt, indent=2) + "\n")
print(json.dumps(receipt, indent=2))
Preserve Raw Evidence When the SLA Excludes Time
Scheduled maintenance, customer configuration, third-party dependencies and events outside provider control are common exclusions. The exact language varies. AWS’s current Compute SLA, for example, defines monthly uptime percentage, external connectivity, service credits, claim information and a list of exclusions rather than relying on the percentage alone.
An exclusion should never erase the observation. Preserve two views:
- Raw user view: every observed good and bad event in the declared monitoring scope.
- Contract view: the same evidence after named, authorized exclusions are applied exactly as the agreement permits.
The next calculation excludes only probe 12 as an announced synthetic maintenance event. Raw availability remains 17/20 = 85%; the adjusted view is 17/19 = 89.4737%. Both numbers and the reason remain in the receipt.
import csv, json
from pathlib import Path
root = Path("/var/tmp/voxfor-hosting-sla-lab-124")
rows = list(csv.DictReader((root / "probes.csv").open()))
excluded = {12: "announced maintenance fixture"}
included = [r for r in rows if int(r["probe"]) not in excluded]
raw_good = [r for r in rows if 200 <= int(r["http_code"]) < 300
            and float(r["time_total_seconds"]) < 0.150]
contract_good = [r for r in included if 200 <= int(r["http_code"]) < 300
                 and float(r["time_total_seconds"]) < 0.150]
receipt = {
    "raw_numerator": len(raw_good), "raw_denominator": len(rows),
    "raw_percent": round(100 * len(raw_good) / len(rows), 4),
    "excluded_probe_ids": sorted(excluded), "exclusion_reasons": excluded,
    "contract_numerator": len(contract_good),
    "contract_denominator": len(included),
    "contract_percent": round(100 * len(contract_good) / len(included), 4),
}
(root / "exclusion-receipt.json").write_text(json.dumps(receipt, indent=2) + "\n")
print(json.dumps(receipt, indent=2))
Uptrends documents a useful real-world example of why policy must be visible: its calculation rules describe how confirmed errors, unknown time, paused monitors and maintenance affect its reports. Those are product rules, not universal SLA law. Ask how the provider classifies the interval between the last good check, the first failed check and the first recovery check.
A Probe Interval Can Hide an Outage
Discrete checks do not observe every second. Suppose a monitor checks at seconds 0, 60 and 120. An outage beginning at second 61 and ending at second 119 can affect users for 58 seconds while every scheduled sample remains healthy.
probe_seconds = [0, 60, 120]
outage_start, outage_end = 61, 119
observed_failures = [t for t in probe_seconds if outage_start <= t < outage_end]
result = {
    "probe_seconds": probe_seconds,
    "outage_interval_seconds": [outage_start, outage_end],
    "outage_duration_seconds": outage_end - outage_start,
    "observed_failed_probes": observed_failures,
    "missed_by_schedule": len(observed_failures) == 0,
}
print(result)
assert result["outage_duration_seconds"] == 58
assert result["missed_by_schedule"] is True
More frequent checks reduce that blind interval but do not make one monitoring location omniscient. DNS, routing, CDN, certificate and regional failures may affect only part of the audience. Monitoring frequency should therefore be shorter than the outage duration the business needs to detect, and the report should disclose check interval, locations, confirmation rules and missing-data treatment.
Self-hosted monitoring can be appropriate when the team owns its availability and retention. For implementation details, Uptime Kuma deployment guidance explains private dashboard access and testing an external alert route. Keep at least one probe outside the infrastructure it evaluates; a monitor that fails with the site creates an evidence gap at the worst moment.
Read the Receipt Before Choosing a Plan
The reproduced outputs join the central decisions without claiming that a twenty-probe sample represents a month:
total_probes=20
http_2xx=18 http_availability_percent=90.0
good_under_150ms=17 user_sli_percent=85.0
failed_probe_ids=7,12,18
calendar_window=2026-08 period_seconds=2678400
allowed_downtime_seconds: 99.9=2678 99.95=1339 99.99=268
raw=17/20=85.0 excluded_probe_ids=12 contract=17/19=89.4737
sampling_gap: probes=0,60,120 outage=[61,119) duration=58 observed_failures=0
The receipt is internally consistent when twenty probe rows produce eighteen 2xx events, seventeen events meet the declared latency rule, only IDs 7, 12 and 18 fail that user-good rule, the 31-day budgets are 2,678, 1,339 and 268 seconds, the raw view remains 17/20, the single named exclusion produces 17/19, and the interval example shows a 58-second outage missed by all three scheduled checks. Any changed threshold, exclusion, calendar window or probe schedule requires a new receipt rather than a silent edit to the final percentage.
Before purchase, ask the provider five questions and require written answers:
- What window is used? Calendar month, billing month, rolling period or year?
- What is unavailable? Host connectivity, network reachability, HTTP status, correct content, latency, or a complete transaction?
- Who measures it? Provider telemetry, customer evidence, third-party monitoring, or a ticket timestamp?
- What is excluded? Planned work, upstream failures, customer actions, DDoS events, missing data, partial regions, or degraded performance?
- What is the remedy? Automatic credit or a claim; amount, deadline, evidence and exclusions?
The answer should fit the workload. A business that cannot tolerate one 44-minute incident may need architecture across failure domains, faster recovery and an operational owner—not merely another nine in marketing copy. Compare dedicated and cloud workload boundaries when placement and redundancy are part of the decision.
Responsibility has a price as well. A managed plan may own monitoring and response; an unmanaged server leaves those jobs with the customer. Compare managed and unmanaged VPS responsibility before an incident exposes an unowned monitoring or response task. Whatever model you choose, do not assume a service credit reimburses lost sales, staff time or reputation. It is usually a bounded contractual remedy.
FAQ: Hosting Uptime SLA Calculations
What does 99.9% uptime allow in a 31-day month?
Using the actual 31-day denominator, 99.9% allows 2,678.4 seconds of downtime, which rounds to 44 minutes 38 seconds. Check the agreement’s rounding rule and whether it uses the calendar month, billing month or another window.
Does 99.99% mean there will be no outage?
No. In the same 31-day month, 99.99% allocates about 268 seconds, or 4 minutes 28 seconds. The full budget can be consumed in one concentrated incident, and contract exclusions may produce a different credit calculation from the user’s raw experience.
Is every HTTP 200 response counted as uptime?
Only when the measurement contract defines success that way. A meaningful user-facing indicator may also require expected content, an authenticated action, checkout completion or a latency boundary. Publish the exact good-event rule with the percentage.
Does scheduled maintenance count against an uptime SLA?
It depends on the agreement. Many SLAs exclude properly announced maintenance, but notice period, maximum duration and overrun rules differ. Keep maintenance in the raw evidence and apply a named exclusion only in the separate contractual view.
How often should a website’s uptime be checked?
Use an interval shorter than the outage duration the business needs to detect, and disclose that interval in reports. A five-minute schedule can miss a shorter outage between checks; even frequent probes need multiple locations and explicit confirmation rules for material claims.
What usually happens when a provider breaches an SLA?
Many hosting and cloud SLAs offer a service credit after a valid claim or automatic calculation. The agreement should state the credit tier, claim deadline and required evidence. A credit is not normally compensation for lost revenue or customer trust.
How is an SLA different from an SLO?
An SLA is an external commitment that defines measurement and remedies between parties. An SLO is an internal reliability target used to prioritize work and manage an error budget. A team can set an SLO stricter than its customer-facing SLA to leave operational margin.
Keep the Evidence and Remove the Fixture
Cleanup is complete only after the recorded loopback server PID has stopped, port 18765 no longer accepts a connection, and the exact marker-guarded lab directory is absent. Preserve the secret-free CSV, analysis, calendar-budget and exclusion receipts elsewhere before cleanup if they are needed for review. In production, rollback means reverting only the monitoring-policy change while retaining raw outage evidence; it never means deleting inconvenient downtime from the record.
set -euo pipefail
LAB=/var/tmp/voxfor-hosting-sla-lab-124
PORT=18765
[[ "$LAB" == /var/tmp/voxfor-hosting-sla-lab-124 ]]
[[ -f "$LAB/.voxfor-hosting-sla-lab" ]]
pid=$(cat "$LAB/server.pid")
[[ "$pid" =~ ^[0-9]+$ && "$pid" -gt 1 ]]
if [[ -d "/proc/$pid" ]]; then
  python3 - "$LAB" "$pid" <<'PY'
import os, select, signal, sys
from pathlib import Path
root = Path(sys.argv[1]).resolve()
pid = int(sys.argv[2])
expected_start = (root / "server.start_ticks").read_text().strip()
pidfd = os.pidfd_open(pid)
try:
    args = [item.decode() for item in
            Path(f"/proc/{pid}/cmdline").read_bytes().split(b"\0") if item]
    actual_start = Path(f"/proc/{pid}/stat").read_text().split()[21]
    assert args and Path(args[0]).name.startswith("python3")
    assert any(Path(arg).resolve() == root / "server.py" for arg in args[1:])
    assert actual_start == expected_start
    signal.pidfd_send_signal(pidfd, signal.SIGTERM)
    poller = select.poll(); poller.register(pidfd, select.POLLIN)
    assert poller.poll(3000), "lab server did not stop within 3 seconds"
finally:
    os.close(pidfd)
PY
fi
! curl -fsS --max-time 1 "http://127.0.0.1:$PORT/checkout-health" >/dev/null 2>&1
rm -rf -- "$LAB"
[[ ! -e "$LAB" ]]
printf 'cleanup=ok guarded_lab_absent=yes\n'
Keep the real purchasing receipt: exact contract version, measurement window, good-event definition, monitoring locations and interval, raw observations, every applied exclusion, adjusted numerator and denominator, credit terms, and the person who owns the claim. That evidence makes the uptime percentage a decision tool instead of a promise you cannot audit.