Lifetime VPS Europe
 Lifetime VPS Asia
 Lifetime WooCommerce Hosting
 Lifetime Hosting
 Lifetime Game Dedicated Servers
 Chicago, US
 Tokyo, Japan
 Singapore
 Hong Kong
 Seoul, South Korea
 Amsterdem, Netherlands
 London, UK
 Stockholm, Sweden
 Oslo, Norway
 Vienna, Austria
 Zurich, Switzerland
 Sydney, Australia
 Wordpress Hosting
 VPS Hosting
 DDOS Protection
 Submit Ticket
 Full Management
 Guides
 Videos and Podcasts
 Discover Creative Ideas
 Voxfor Autonomous AI Workers
 Voxfor Mega Menu
 Voxfor Advanced Price Management For WooCommerce
 Voxfor Secure Live Chat and AI Support
 Voxfor Multilanguage
 Voxfor AI Content Summary
 Voxfor Autopilot
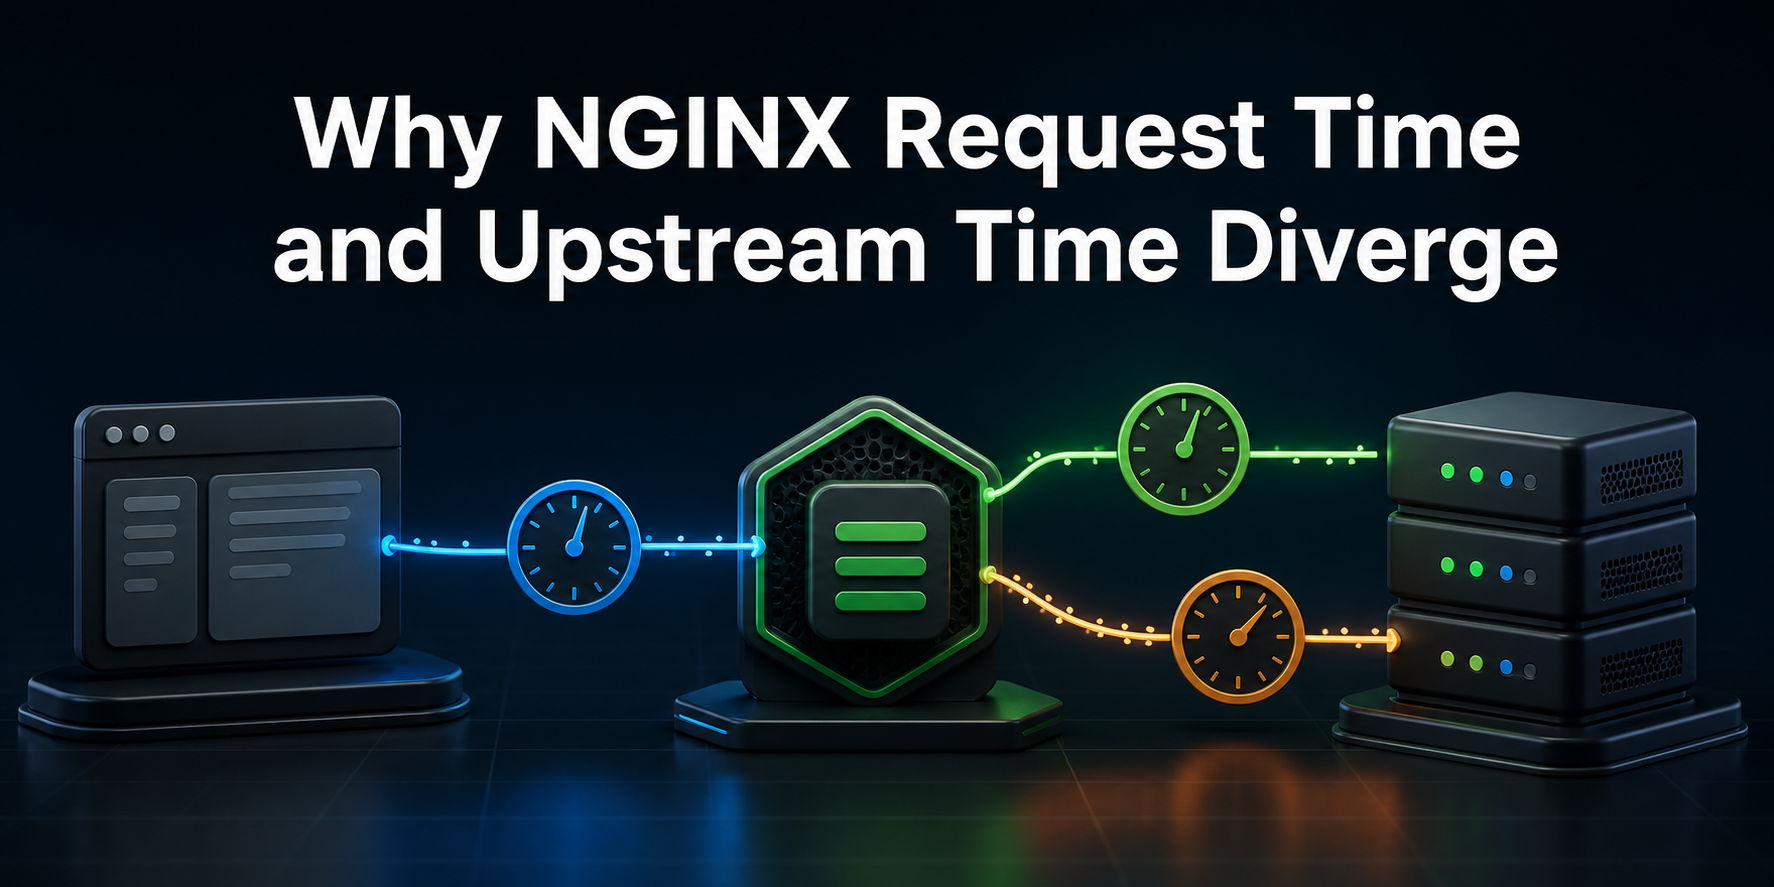
Subtracting $upstream_response_time from $request_time does not reveal a single hidden NGINX phase. The two clocks have different boundaries. Request time follows the client-facing lifetime that NGINX records, while upstream timers describe one or more proxy attempts. Time can accumulate before NGINX sends a buffered request upstream, inside the upstream exchange, or after the upstream has finished while NGINX delivers the response.
That distinction changes the first owner you investigate. A large request time with a tiny upstream time might be a slow upload, downstream backpressure, rate limiting, local proxy work, or a retry history—not necessarily a slow application. This guide builds a secret-free loopback experiment that makes each boundary visible before applying the same log fields to production.
Reproduction used Debian 13.6 with NGINX 1.26.3, Python 3.13.5 and curl 8.14.1. The intended reader is a developer or self-managed operator who can validate an NGINX configuration and read JSON logs. This is not a capacity benchmark; the deliberate delays exist only to separate measurement phases.
The Clocks Do Not Start and Stop Together
NGINX’s official log-module reference defines $request_time as elapsed time from reading the first bytes from the client until the log write after the last bytes are sent. In an ordinary completed request, that can include request-body receipt, routing and proxy work, upstream time, response filters, rate limiting and client-facing delivery.
Upstream variables start later. The upstream-module reference separates connection establishment ($upstream_connect_time), time through receipt of upstream response headers ($upstream_header_time), and the full upstream response ($upstream_response_time). They describe upstream attempts, not the complete client-facing transaction.
Therefore, this residual is useful but unnamed:
request-side residual = request_time - upstream_response_timeTreat it as a clue, not a universal metric. Millisecond rounding can create tiny negative values. Retries can produce comma- or colon-separated upstream values. A cache hit or locally served response can produce - because no upstream was contacted. Summing or subtracting without first parsing that structure invents precision.
An NGINX maintainer’s direct timing explanation makes the same boundary explicit: receiving the request from the client and sending the response back can add time outside the upstream exchange. The controlled cases below prove both sides independently instead of assuming which one occurred.
This article is also deliberately narrower than diagnosing an NGINX 499. A 499 says the client connection ended before NGINX completed the response. Timing divergence can happen on a successful 200 response where both sides remain connected.
Log One Correlation-Safe Timing Record
Begin with a fixed, marker-guarded lab that refuses to start unless both loopback ports and the target directory are unused. This input writes a tiny Python origin with fast, delayed-header, streamed-body and one-megabyte endpoints. NGINX uses JSON escaping, includes $request_id, buffers request bodies, and applies a 64 KiB/s rate only to /paced. The packaged production service user should remain unchanged; nobody is used only for the disposable lab worker.
set -Eeuo pipefail
LAB=/tmp/voxfor-nginx-timing-137
ORIGIN_PORT=19137
NGINX_PORT=19138
MARKER="$LAB/.voxfor-nginx-timing-137"
[[ ! -e "$LAB" ]]
[[ -z "$(ss -H -ltn "sport = :$ORIGIN_PORT")" ]]
[[ -z "$(ss -H -ltn "sport = :$NGINX_PORT")" ]]
install -d -m 755 "$LAB/logs" "$LAB/temp/client" "$LAB/temp/proxy"
: > "$MARKER"
cat > "$LAB/origin.py" <<'PY'
#!/usr/bin/env python3
import hashlib, json, time
from http.server import BaseHTTPRequestHandler, ThreadingHTTPServer
LARGE = b'x' * (1024 * 1024)
class Handler(BaseHTTPRequestHandler):
    protocol_version = 'HTTP/1.1'
    def log_message(self, fmt, *args): pass
    def send_bytes(self, body, kind='text/plain'):
        self.send_response(200); self.send_header('Content-Type', kind)
        self.send_header('Content-Length', str(len(body))); self.end_headers()
        self.wfile.write(body); self.wfile.flush()
    def do_GET(self):
        if self.path == '/fast': self.send_bytes(b'fast-ok\n')
        elif self.path == '/slow-header':
            time.sleep(1.2); self.send_bytes(b'slow-header-ok\n')
        elif self.path == '/slow-body':
            chunks = [b'a' * 16384] * 4
            self.send_response(200); self.send_header('Content-Length', str(sum(map(len, chunks))))
            self.end_headers()
            for chunk in chunks:
                self.wfile.write(chunk); self.wfile.flush(); time.sleep(0.3)
        elif self.path == '/large': self.send_bytes(LARGE, 'application/octet-stream')
        else: self.send_response(404); self.end_headers()
    def do_POST(self):
        body = self.rfile.read(int(self.headers.get('Content-Length', '0')))
        receipt = json.dumps({'received': len(body), 'sha256': hashlib.sha256(body).hexdigest()}).encode()+b'\n'
        self.send_bytes(receipt, 'application/json')
ThreadingHTTPServer(('127.0.0.1', 19137), Handler).serve_forever()
PY
cat > "$LAB/nginx.conf" <<'EOF'
user nobody nogroup;
pid logs/nginx.pid;
error_log logs/error.log notice;
events { worker_connections 128; }
http {
    access_log off;
    client_body_temp_path temp/client;
    proxy_temp_path temp/proxy;
    log_format timing escape=json '{"request_id":"$request_id","method":"$request_method","path":"$uri","status":$status,"bytes":$body_bytes_sent,"rt":$request_time,"uct":"$upstream_connect_time","uht":"$upstream_header_time","urt":"$upstream_response_time"}';
    server {
        listen 127.0.0.1:19138;
        access_log logs/timing.jsonl timing;
        location = /paced {
            limit_rate 64k;
            proxy_pass http://127.0.0.1:19137/large;
            proxy_http_version 1.1; proxy_set_header Connection ""; proxy_buffering on;
        }
        location / {
            proxy_pass http://127.0.0.1:19137;
            proxy_http_version 1.1; proxy_set_header Connection "";
            proxy_buffering on; proxy_request_buffering on;
        }
    }
}
EOF
chown -R nobody:nogroup "$LAB/temp"
python3 "$LAB/origin.py" >"$LAB/logs/origin.log" 2>&1 &
echo $! > "$LAB/origin.pid"
for _ in {1..50}; do curl -fsS "http://127.0.0.1:$ORIGIN_PORT/fast" >/dev/null 2>&1 && break; sleep 0.05; done
nginx -t -p "$LAB/" -c nginx.conf
nginx -p "$LAB/" -c nginx.conf
for _ in {1..50}; do curl -fsS "http://127.0.0.1:$NGINX_PORT/fast" >/dev/null 2>&1 && break; sleep 0.05; done
ORIGIN_PID=$(<"$LAB/origin.pid")
NGINX_PID=$(<"$LAB/logs/nginx.pid")
kill -0 "$ORIGIN_PID"; kill -0 "$NGINX_PID"
ss -ltnp "sport = :$ORIGIN_PORT" | grep -q "pid=$ORIGIN_PID,"
ss -ltnp "sport = :$NGINX_PORT" | grep -q "pid=$NGINX_PID,"
: > "$LAB/logs/timing.jsonl"
For field semantics and multi-value delimiters, use the official logging guide as the authority. JSON escaping matters because request paths, referers and user agents can contain quotes or control characters. In production, add the correlation ID used by your application or trace system; do not log authorization headers, cookies or request bodies merely to explain latency.
Separate Upstream Header Wait From Body Transfer
Three upstream controls come next. /fast proves the stack itself is near zero. /slow-header waits before sending headers, while /slow-body sends headers immediately and then spaces four body chunks over about 0.9 seconds. Checksums and byte counts prove curl received the intended objects rather than an error page.
set -Eeuo pipefail
LAB=/tmp/voxfor-nginx-timing-137; NGINX_PORT=19138
[[ -f "$LAB/.voxfor-nginx-timing-137" ]]
ORIGIN_PID=$(<"$LAB/origin.pid"); NGINX_PID=$(<"$LAB/logs/nginx.pid")
kill -0 "$ORIGIN_PID"; kill -0 "$NGINX_PID"
curl -fsS -o "$LAB/fast.out" "http://127.0.0.1:$NGINX_PORT/fast"
curl -fsS -o "$LAB/slow-header.out" "http://127.0.0.1:$NGINX_PORT/slow-header"
curl -fsS -o "$LAB/slow-body.out" "http://127.0.0.1:$NGINX_PORT/slow-body"
grep -qx 'fast-ok' "$LAB/fast.out"
grep -qx 'slow-header-ok' "$LAB/slow-header.out"
[[ "$(wc -c < "$LAB/slow-body.out")" == 65536 ]]
[[ "$(wc -l < "$LAB/logs/timing.jsonl")" == 3 ]]
If header time and full upstream time both rise, investigate work before the application commits its response headers: pool admission, database work, remote calls, lock contention or application queueing. If header time stays small while response time grows, the upstream began responding quickly but produced or transferred the body slowly. The NGINX article on logging for application performance monitoring uses this separation to turn one generic response time into actionable application phases.
Do not infer the exact upstream subsystem from an NGINX timer alone. Once the boundary points to the application, correlate the request ID with application traces and resource evidence. A WordPress origin, for example, can wait for an available PHP-FPM worker before application code progresses.
Prove That Upload Time Can Precede the Upstream
With proxy_request_buffering on, NGINX reads the request body before it sends the proxied request. The third input uploads 256 KiB at 32 KiB/s, then validates the origin’s byte count and SHA-256 receipt. The fixture takes about eight seconds by design.
set -Eeuo pipefail
LAB=/tmp/voxfor-nginx-timing-137; NGINX_PORT=19138
[[ -f "$LAB/.voxfor-nginx-timing-137" ]]
NGINX_PID=$(<"$LAB/logs/nginx.pid"); kill -0 "$NGINX_PID"
head -c 262144 /dev/zero > "$LAB/upload.bin"
EXPECTED=$(sha256sum "$LAB/upload.bin" | cut -d' ' -f1)
curl -fsS --limit-rate 32K --data-binary @"$LAB/upload.bin" \
  -o "$LAB/upload-receipt.json" "http://127.0.0.1:$NGINX_PORT/upload"
node - "$LAB/upload-receipt.json" "$EXPECTED" <<'NODE'
const fs=require('fs'); const row=JSON.parse(fs.readFileSync(process.argv[2]));
if(row.received!==262144 || row.sha256!==process.argv[3]) process.exit(1);
NODE
[[ "$(wc -l < "$LAB/logs/timing.jsonl")" == 4 ]]
Expect a large $request_time and tiny upstream timers in this buffered fixture. That does not make uploads universally invisible to the upstream. Turning proxy_request_buffering off, using chunked input, streaming through another proxy, or letting the application read the body changes the phase boundary. Record buffering configuration alongside the timing row.
If the client leaves before completion, branch to the 499 workflow. If the request completes, segment by method, content length, endpoint and trusted network—not by raw IP or secret-bearing URL. A fleet-wide increase suggests ingress capacity or network pressure; isolated large POSTs suggest a request-specific upload path.
Prove That Delivery Can Outlive the Upstream
A slow reader is not guaranteed to inflate $request_time: the kernel socket buffer may accept a small response immediately even if the client consumes it slowly. The reproduced negative control first used a client-side rate limit alone and did not create a reliable gap. The final input controls the NGINX output phase with limit_rate 64k and a one-megabyte response, making about 16 seconds of post-upstream delivery deterministic.
set -Eeuo pipefail
LAB=/tmp/voxfor-nginx-timing-137; NGINX_PORT=19138
[[ -f "$LAB/.voxfor-nginx-timing-137" ]]
NGINX_PID=$(<"$LAB/logs/nginx.pid"); kill -0 "$NGINX_PID"
curl -fsS -o "$LAB/large.out" "http://127.0.0.1:$NGINX_PORT/paced"
[[ "$(wc -c < "$LAB/large.out")" == 1048576 ]]
[[ "$(sha256sum "$LAB/large.out" | cut -d' ' -f1)" == "$(printf '%1048576s' '' | tr ' ' x | sha256sum | cut -d' ' -f1)" ]]
[[ "$(wc -l < "$LAB/logs/timing.jsonl")" == 5 ]]
Next, parse the five JSON records and require one row per path. Each check owns a different fact rather than repeating one arbitrary threshold five times: header delay must appear before headers; streamed-body delay must appear after headers but inside upstream time; upload and paced delivery must create large request-side residuals; every response must remain 200.
set -Eeuo pipefail
LAB=/tmp/voxfor-nginx-timing-137
[[ -f "$LAB/.voxfor-nginx-timing-137" ]]
node - "$LAB/logs/timing.jsonl" <<'NODE'
const fs=require('fs');
const rows=fs.readFileSync(process.argv[2],'utf8').trim().split(/\n+/).map(JSON.parse);
const by=Object.fromEntries(rows.map(r=>[r.path,r])); const n=Number;
if(rows.length!==5 || new Set(rows.map(r=>r.path)).size!==5) process.exit(1);
const checks={
  fast:n(by['/fast'].rt)<0.2 && n(by['/fast'].urt)<0.2,
  header:n(by['/slow-header'].uht)>=1 && n(by['/slow-header'].urt)>=1,
  body:n(by['/slow-body'].uht)<0.2 && n(by['/slow-body'].urt)>=0.8,
  upload:n(by['/upload'].rt)-n(by['/upload'].urt)>=5,
  delivery:n(by['/paced'].rt)-n(by['/paced'].urt)>=10,
  status:rows.every(r=>r.status===200)
};
for(const [name,ok] of Object.entries(checks)) console.log(`${name}=${ok?'yes':'no'}`);
if(Object.values(checks).some(ok=>!ok)) process.exit(1);
NODE
Here is the representative output from the complete rehearsal. The exact milliseconds will vary; the phase shape is the evidence.
{"path":"/fast","status":200,"bytes":8,"rt":0.001,"uct":"0.000","uht":"0.002","urt":"0.002"}
{"path":"/slow-header","status":200,"bytes":15,"rt":1.202,"uct":"0.000","uht":"1.201","urt":"1.201"}
{"path":"/slow-body","status":200,"bytes":65536,"rt":0.902,"uct":"0.000","uht":"0.001","urt":"0.902"}
{"path":"/upload","status":200,"bytes":98,"rt":8.001,"uct":"0.000","uht":"0.002","urt":"0.002"}
{"path":"/paced","status":200,"bytes":1048576,"rt":16.039,"uct":"0.000","uht":"0.001","urt":"0.002"}
checks: fast=yes, header=yes, body=yes, upload=yes, delivery=yes, status=yes
cleanup: NGINX stopped, origin stopped, marker-guarded lab absent
This also explains why estimating bandwidth from NGINX logs needs byte fields while latency diagnosis needs timing fields. The same access record can support both tasks, but bytes and elapsed time answer different capacity questions.
Turn the Residual Into a Production Decision
Do not deploy a log format and immediately alert on request_time - upstream_response_time. Sample a normal window, preserve raw multi-upstream values, group only dimensions that do not leak secrets, and compare the timing shape with application traces and an external probe.
| Observed shape | Bounded phase | Evidence to collect next | Decision |
|---|---|---|---|
uht and urt both high |
Before upstream headers | App trace, pool queue, DB/remote-call spans | Investigate upstream admission or work |
uht low, urt high |
Upstream body production/transfer | Response streaming trace, origin network and bytes | Investigate body generation or upstream path |
rt high, upstream tiny on large writes |
Before proxy attempt under buffering | Method, content length, buffering config, ingress rate | Investigate request receipt and upload path |
rt high, upstream tiny on large reads |
After upstream completion or local proxy work | Bytes, rate limits, socket/network pressure, client cohort | Investigate delivery and NGINX-side phases |
Retries require extra care. Upstream addresses, statuses and times can be lists, and their delimiters reflect groups and attempts. Retain the raw arrays and correlate corresponding positions instead of selecting the last number or subtracting a string. A failed active probe is another problem: use the HAProxy backend health-check workflow when availability comes from probe state rather than a completed request row.
External checks bound everything outside this NGINX instance. Prometheus Blackbox Exporter probes separate DNS, TCP, TLS and HTTP timing, while customer-journey monitoring tests the actual sequence a user needs. Neither replaces the access log; agreement between layers narrows ownership.
Roll out the new log format on a canary server or low-volume location, validate with nginx -t, reload gracefully, confirm valid JSON arrives with non-secret correlation fields, and watch log volume and ingestion errors. The experiment’s cleanup is exact and marker-gated:
set -Eeuo pipefail
LAB=/tmp/voxfor-nginx-timing-137
[[ -f "$LAB/.voxfor-nginx-timing-137" ]]
ORIGIN_PID=$(<"$LAB/origin.pid"); NGINX_PID=$(<"$LAB/logs/nginx.pid")
kill -0 "$ORIGIN_PID"; kill -0 "$NGINX_PID"
nginx -p "$LAB/" -c nginx.conf -s quit
for _ in {1..50}; do [[ ! -e "$LAB/logs/nginx.pid" ]] && break; sleep 0.05; done
kill "$ORIGIN_PID"; wait "$ORIGIN_PID" 2>/dev/null || true
[[ ! -e "$LAB/logs/nginx.pid" ]]
! kill -0 "$ORIGIN_PID" 2>/dev/null
[[ -z "$(ss -H -ltn 'sport = :19137')" ]]
[[ -z "$(ss -H -ltn 'sport = :19138')" ]]
find "$LAB" -mindepth 1 -delete
rmdir "$LAB"
[[ ! -e "$LAB" ]]
The timing interpretation is ready for production use only when the log is valid JSON, request and upstream fields belong to the same correlated transaction, retry values remain intact, a fast control is present, each suspected phase has an independent control or external trace, response status and bytes match the intended object, and the same timing shape repeats across more than one request without exposing secrets.
If the canary reload, JSON parsing, log-volume budget or privacy check fails, restore the exact previous log_format and access_log directives from the configuration backup, run nginx -t, reload gracefully, and confirm the prior log stream resumes. Stop and remove only the marker-guarded loopback lab; do not delete production logs or change proxy buffering merely to make the timers align.
FAQ: Questions That Change the Diagnosis
Can request time be lower than upstream response time?
Yes, by a few milliseconds because the variables have millisecond resolution and are recorded at slightly different events. Retries, streamed responses and list parsing can also create an invalid comparison. Treat a large persistent negative value as a parsing or correlation problem before treating it as system behavior.
Why is upstream response time a dash?
NGINX can serve a response without contacting an upstream—for example from a local file, cache, rewrite or immediate error path. A dash can also appear when no upstream timing value exists. Preserve status, cache status, location identity and upstream address before converting the value to null; never convert it to zero silently.
How do retries change upstream timing values?
Multiple upstream attempts can produce corresponding lists of addresses, statuses and times, separated according to attempt groups. Parse the raw fields as aligned structures and retain every attempt. The final attempt alone cannot explain time spent on earlier failures.
Does a slow client always increase request time?
No. If NGINX or the kernel buffers the complete response quickly, the access log may be written before a client’s application consumes the bytes. Slow delivery becomes visible when backpressure or a configured rate limit keeps the NGINX request open. Response size, buffering and socket pressure determine the effect.
Should I disable proxy buffering to make the metrics clearer?
Not just for measurement. Buffering affects memory, disk, streaming, upstream occupancy and client isolation. Record the current configuration and reproduce the actual path. Change buffering only for an application requirement with its own load test and rollback.
What do the timers mean for WebSockets or long streams?
Long-lived upgraded or streaming connections intentionally keep the client-facing request open. Their total duration is not ordinary page latency, and upstream semantics depend on the protocol path. Separate those locations and monitor connection lifecycle, message delay or stream-specific service objectives instead of applying request thresholds.
Which metric should alert first?
Alert on a user-facing objective such as external latency or successful journey completion, then use NGINX phase fields for diagnosis. A high upstream header percentile can be a useful application signal, but only after endpoint, status, retry and cache behavior are controlled. One residual threshold cannot own every architecture.