Core Web Vitals (LCP, INP, CLS) are Google standard for page experience; they affect search rankings and., more importantly, conversions and engagement. This guide explains what they measure, why they matter for SEO, how to measure them, and step-by-step tactics (with diagnostics and a practical checklist) to get them into the “Good” range.
What are Core Web Vitals?
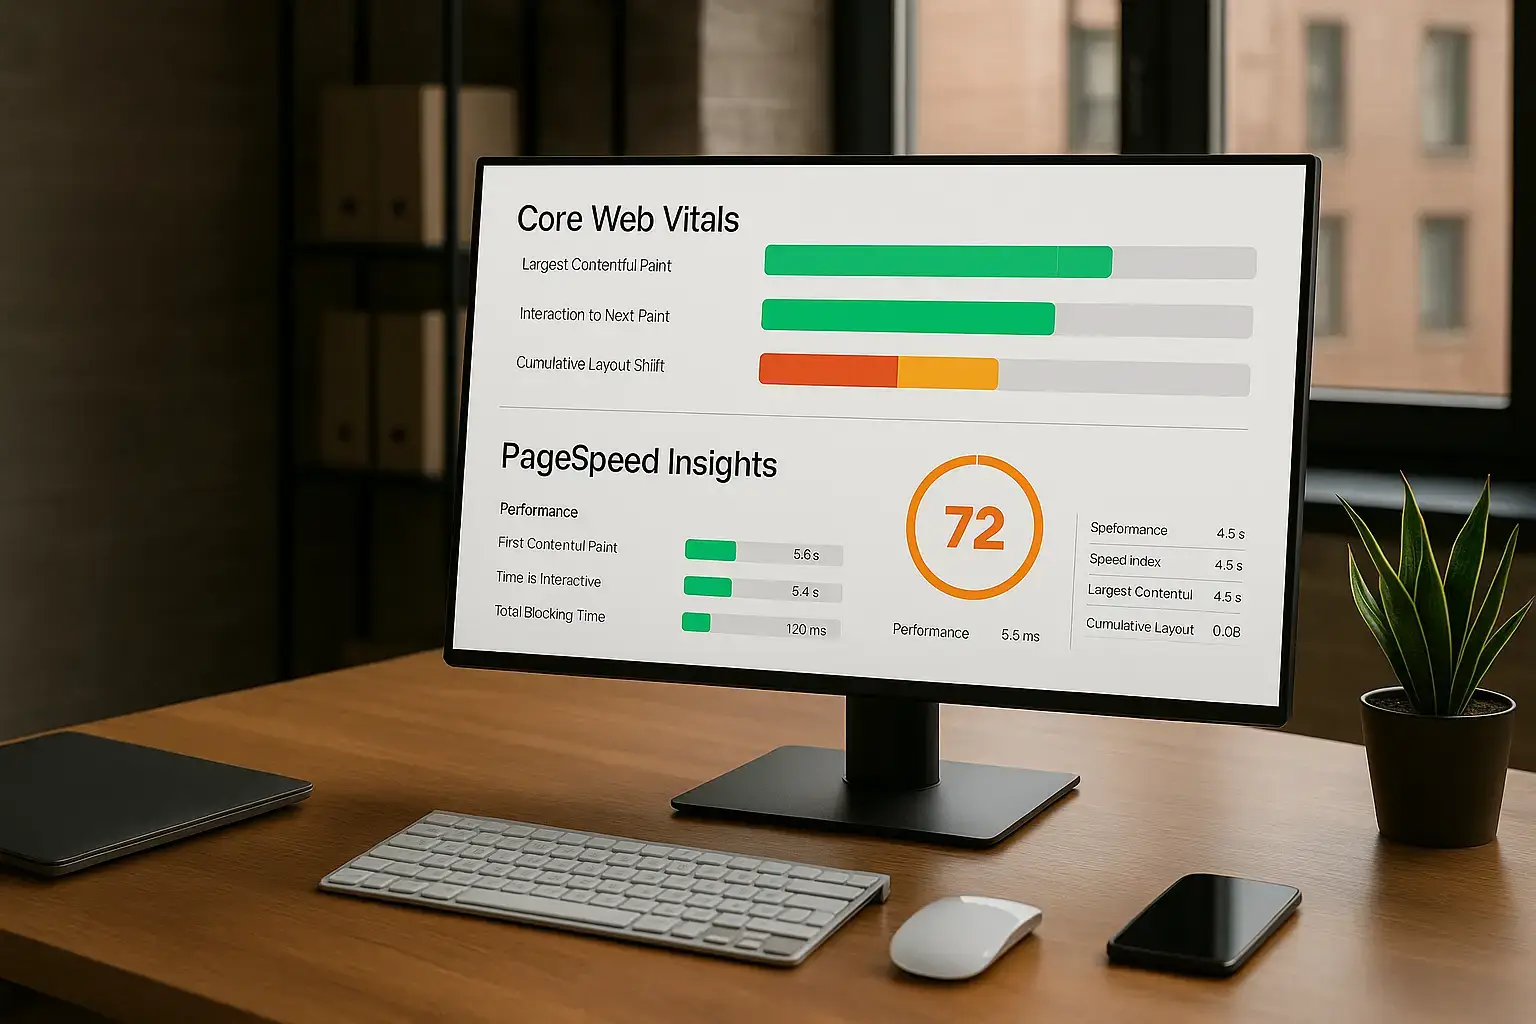
Largest Contentful Paint (LCP): when the main content (hero image, headline block, large text block) becomes visible. You want this to happen fast — ideally within 2.5 seconds on real users.
Interaction to Next Paint (INP): measures how responsive the site feels when a user interacts (click, tap, keyboard). INP replaces FID and reflects overall interactivity; target ≤200 ms.
Cumulative Layout Shift (CLS): measures unexpected layout shifts (content jumping around). Target ≤0.1. Give visual elements reserved space (so they don’t move) to keep CLS low.
These thresholds are based on real-user (field) data, and Google evaluates performance at a percentile level (commonly the 75th percentile). Passing all three at the required percentile is considered a “Good” Core Web Vitals assessment.
Why Core Web Vitals matter for SEO
Ranking signal: Core Web Vitals are part of Google Page Experience signals. They are one of many ranking factors and can tip the balance between pages with similar content. If two pages are similar, the one with better experience often gets the edge.
Real business impact: Faster, stable, responsive pages increase conversions, reduce bounce, and improve engagement (real-world case studies repeatedly show measurable lifts from speed/stability improvements).
Remember: content relevance and quality still dominate rankings. Core Web Vitals won’t outrank better content, but they can meaningfully improve visibility and user metrics when content quality is comparable.
How Google measures Core Web Vitals (tools & data types)
Field (real-user) data: Chrome UX Report (CrUX) / Search Console / PageSpeed Insights field data. These measure what real users experience and are used for ranking signals.
Lab data: Lighthouse / PageSpeed Insights lab audits simulate a single environment; great for debugging but not identical to field data. Use lab tests to reproduce and fix issues; validate with field data afterwards.
Primary tools to use:
Google Search Console — Core Web Vitals report (URL-group view).
PageSpeed Insights — combined field + lab view for a page.
Lighthouse (DevTools) — actionable lab audits and trace (good for reproducing slow tasks).
web.dev guides — detailed best practices per metric.
Deep dive: metric-by-metric fixes
1) Improve LCP (Largest Contentful Paint)
LCP is about getting the main content painted quickly.
Primary causes:
Slow server response (TTFB)
Render-blocking CSS/JS
Large images or unoptimized fonts
LCP element being loaded late (e.g., hero loaded via JS)
Practical fixes (ordered by ROI):
Server & CDN: Use a fast host + CDN to reduce TTFB and geographic latency. Cache HTML where possible (edge caching / surrogate keys).
Prioritize critical resources: Inline critical CSS for above-the-fold, defer non-critical CSS/JS, and use rel=”preload” for hero images or fonts used in the LCP block.
Optimize images: Use modern formats (AVIF/WebP where supported), properly sized responsive images (srcset), and efficient compression. Serve images from a CDN.
Avoid heavy JavaScript before render: Defer scripts, split bundles, and remove unused code. Use server-side rendering (SSR) or pre-rendering for content that matters.
Fonts: Use font-display: swap and preload critical fonts to avoid FOIT (flash of invisible text), delaying LCP.
Measure: Identify the LCP element using Chrome DevTools Performance tab or the LCP debug info in PageSpeed Insights; then iterate.
2) Improve INP (Interaction to Next Paint)
INP measures responsiveness across interactions, it penalizes long main-thread tasks more than an isolated FID did.
Primary causes:
Long JavaScript tasks (>50ms)
Synchronous JS execution or heavy parsing
Large bundles and long-running work on the main thread
Practical fixes:
Break up long tasks: Split heavy work into smaller chunks with setTimeout/requestIdleCallback/postMessage or use web workers for off-main-thread processing. Yield to the event loop often.
Code-splitting & lazy loading: Load only what’s needed for the first interaction. Defer non-essential scripts.
Reduce JS execution cost: Remove unused libraries, use lighter alternatives (for example, minimal DOM libraries), and optimize event handlers.
Optimize third-party scripts: Load them async or only on interaction; sandbox where possible. Third-party scripts are often the largest contributor to long tasks.
Measure with long task/performance profiling: Use DevTools > Performance and the Long Tasks or Interaction traces to see which tasks dominate INP.
3) Reduce CLS (Cumulative Layout Shift)
CLS tracks unexpected visual shifts. It’s often fixable with layout discipline.
Reserve space: Always include width and height attributes for images or use CSS aspect-ratio boxes so the browser can allocate layout space before the asset loads.
Stable ad/iframe slots: Reserve containers of a fixed size or use placeholders; dynamically resize only with animation that doesn’t force a layout shift.
Avoid inserting content above existing content: If you must insert elements (e.g., banners), insert them below or reserve space first.
Careful with fonts: Use font-display: swap and preloading strategies to reduce layout reflow.
Measure: Chrome DevTools has a Layout Shift Regions overlay to highlight shifting elements; PageSpeed Insights and Search Console can point to culprit elements in field data.
Diagnostic workflow (how to audit a page end-to-end)
Baseline field data: Check Search Console Core Web Vitals report for group-level issues.
Per-page lab audit: Run PageSpeed Insights for target pages to get lab diagnostics and a prioritized list.
Reproduce in DevTools: Open Chrome DevTools Performance, simulate throttling if needed, record interactions, and use the Performance trace to identify long tasks, paint events, and layout shifts.
Measure again in field: After changes, monitor Search Console/CrUX to ensure real-users see improvements (field data can take time to reflect changes).
Common mistakes & myths
Myth: Lab scores = real ranking result. Lab tools are for reproduction and debugging. Field data (CrUX) matters for ranking. Use both.
Mistake: Over-optimizing for a synthetic Lighthouse score. Don’t chase a 100/100 if it means removing useful UX or accessibility features. Ask: Does the change improve real user experience?
Mistake: Ignoring third-party scripts. Chat widgets, analytics, and ad tags often cause long tasks and layout shifts. Audit and lazy-load or sandbox them.
Myth: Only desktop matters. Mobile is often the stricter test; optimize for mobile-first performance and then for desktop. Google primarily uses mobile-first indexing.
WordPress quick wins (if your site runs WP / WooCommerce)
Use a well-coded, performance-oriented theme (avoid themes that load dozens of assets).
Use image optimization plugins that generate WebP/AVIF and responsive srcset automatically.
Pick a PHP/opcache-friendly host, enable object caching (Redis/Memcached), and use a CDN for static assets.
Use script/asset host plugins to defer non-critical JS and inline critical CSS for above-the-fold.
Audit plugins: remove or replace plugins that inject heavy third-party scripts.
(These are practical pointers for platform-agnostic environments; follow the same principles above.)
Practical checklist (implementable in order)
Measure Search Console + PageSpeed Insights for target pages.
Break up long tasks: code-split JS, use web workers, defer non-critical scripts.
Reserve space for images/ads; set aspect ratios to fix CLS.
Replace heavy third-party widgets or lazy-load them on interaction.
Re-run lab tests; deploy; monitor Search Console for field improvements.
Monitoring & maintenance
Add Core Web Vitals checks to your release checklist. Use synthetic monitors (Lighthouse CI) for pre-release tests and rely on Search Console for field validation.
Keep an eye on new third-party libraries before adding them. Run a “long-task” profile in DevTools to estimate their cost.
Re-test after major content changes (hero images, ads, new widgets).
Frequently Questions Asked
A: Field data (CrUX) is aggregated and may take weeks to show clear movement at the 75th percentile, but lab tests give immediate feedback.
A: No, Page Experience includes HTTPS, mobile-friendliness, and absence of intrusive interstitials in addition to Core Web Vitals.
A: Not necessarily. Use Lighthouse to find issues, but prioritize fixes that improve real-user metrics and conversion.
Conclusion
Improving Core Web Vitals is both a technical and a product effort. The right balance of server performance, asset optimization, and front-end engineering yields measurable SEO and conversion benefits. Start with diagnosis (Search Console + PageSpeed Insights), apply the high-impact fixes listed above, and monitor real-user metrics. Over time, this becomes part of healthy site maintenance, one that improves both rankings and the experience your visitors remember.
About Author
Netanel Siboni is a technology leader specializing in AI, cloud, and virtualization. As the founder of Voxfor, he has guided hundreds of projects in hosting, SaaS, and e-commerce with proven results. Connect with Netanel Siboni on LinkedIn to learn more or collaborate on future projects.


 Lifetime VPS Europe
 Lifetime VPS Asia
 Lifetime Hosting
 France Lifetime Dedicated Servers
 Germany Lifetime dedicated servers
 Lifetime Game Dedicated Servers
 Chicago, US
 Singapore
 Hong Kong
 Seoul, South Korea
 Amsterdem, Netherlands
 London, UK
 Zurich, Switzerland
 Sydney, Australia
 DDOS Protection
 Submit Ticket
 Full Management
 Videos and Podcasts
 Voxfor Advanced Price Management For WooCommerce
 Voxfor AI Content Summary


