Lifetime VPS Europe
 Lifetime VPS Asia
 Lifetime WooCommerce Hosting
 Lifetime Hosting
 Lifetime Game Dedicated Servers
 Chicago, US
 Tokyo, Japan
 Singapore
 Hong Kong
 Seoul, South Korea
 Amsterdem, Netherlands
 London, UK
 Stockholm, Sweden
 Oslo, Norway
 Vienna, Austria
 Zurich, Switzerland
 Sydney, Australia
 Wordpress Hosting
 VPS Hosting
 DDOS Protection
 Submit Ticket
 Full Management
 Guides
 Videos and Podcasts
 Discover Creative Ideas
 Voxfor Autonomous AI Workers
 Voxfor Mega Menu
 Voxfor Advanced Price Management For WooCommerce
 Voxfor Secure Live Chat and AI Support
 Voxfor Multilanguage
 Voxfor AI Content Summary
 Voxfor Autopilot
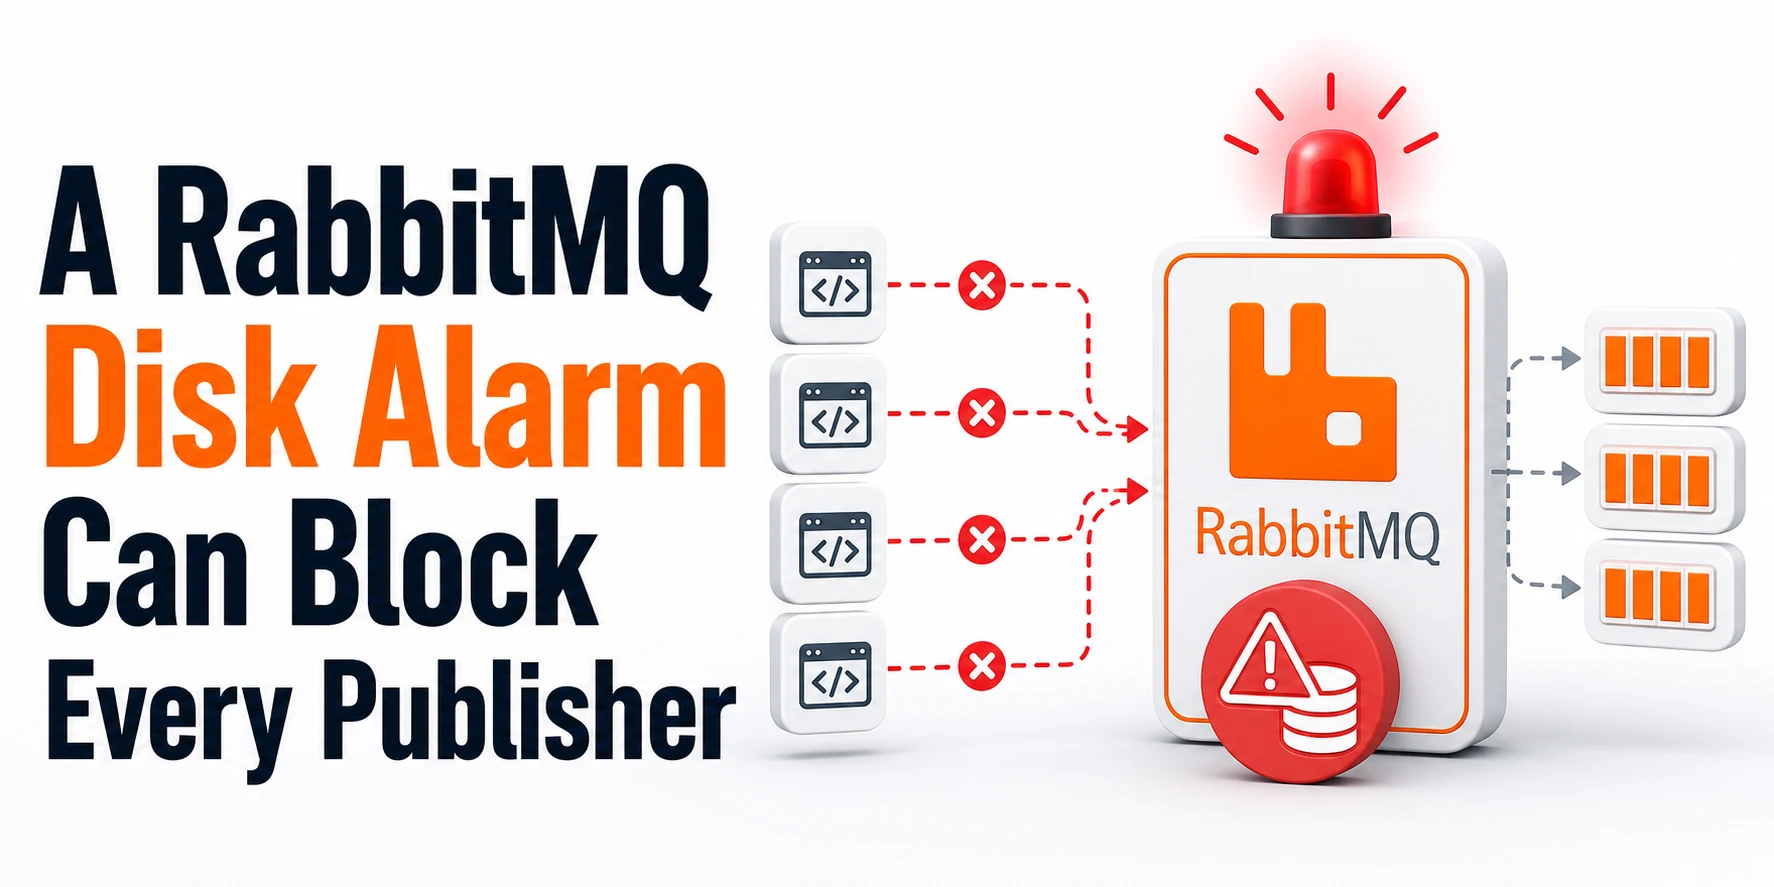
A RabbitMQ node can be running, answering health checks and delivering messages to consumers while every publishing connection is stalled. That split is deliberate: when free space on a node’s database partition falls below disk_free_limit, RabbitMQ applies back pressure to publishers so incoming messages do not consume the remaining disk.
Treat the event as a writable-service failure, not a dead-broker failure. Confirm the alarm, find the node and mounted filesystem that own it, preserve queue and client evidence, then recover real headroom. Restarting RabbitMQ or lowering the watermark does not create capacity.
Treat the RabbitMQ incident as resolved after the alarm is clear on every node, a controlled publish receives a confirm, its consumer processes the message, and free space remains above a durable response-time reserve.
Read the blocked-publisher symptom correctly
RabbitMQ’s resource-alarm behavior explains the apparent contradiction. A node suspends reads from connections that publish when memory or disk reaches its configured watermark. Consumer-only connections are not blocked, so deliveries may continue while new business events, jobs or notifications stop entering the broker.
Mixed producer/consumer connections make the symptom less tidy. RabbitMQ recommends separate connections for producing and consuming where the application design permits it; otherwise one connection can appear slow in ways that hide which role triggered the block. Modern clients can receive connection.blocked notifications, and publishers should use confirms to know which messages the broker actually accepted.
| Traffic role | What a disk alarm can do | Operational meaning |
|---|---|---|
| Publisher-only connection | RabbitMQ stops reading; publishes delay, time out or fail | Broker process health does not prove message acceptance |
| Consumer-only connection | Deliveries continue | Backlog may drain and release disk pressure |
| Mixed connection | Producer back pressure can affect the shared connection | Split roles before relying on latency as diagnosis |
| CLI or management access | May remain available | Use it for evidence, not as proof that the data path is writable |
In a cluster, one node below its watermark can block publishers cluster-wide. Do not limit the investigation to the node behind the first client connection or load balancer target.
Confirm the alarm and its owning node
Ask RabbitMQ before blaming the application
Run cluster and local checks from an account authorized to use the RabbitMQ CLI. The alarms command lists active resource alarms in the cluster, while check_local_alarms returns non-zero if the target node itself has an alarm. status provides the active node context and database/configuration locations needed for the filesystem check.
sudo rabbitmq-diagnostics -q alarms
sudo rabbitmq-diagnostics -q check_local_alarms
sudo rabbitmq-diagnostics -q status
Record the exact node name and whether the alarm is for disk or memory. Both mechanisms block publishers, but memory relief, disk relief and recurrence controls are different. A generic client timeout is not enough evidence to choose either branch.
Map the database directory to the real filesystem
The relevant number is free space on the drive or partition that stores RabbitMQ’s database, not the largest free-space value shown by an unscoped df. Package installations commonly use /var/lib/rabbitmq, but containers, custom RABBITMQ_MNESIA_BASE settings and mounted volumes can place broker state elsewhere. Read the directory reported by status, substitute it below, and identify both capacity and inode pressure.
BROKER_DATA=/var/lib/rabbitmq
sudo findmnt -T "$BROKER_DATA"
sudo df -hT "$BROKER_DATA"
sudo df -i "$BROKER_DATA"
RabbitMQ’s current disk-alarm documentation says the default free-space limit is 50 MB and monitoring becomes more frequent near the boundary. That small default is a mechanism fallback, not a production capacity recommendation; a fast paging or persistence burst can consume it between checks.
Preserve evidence before freeing space
Capture one compact incident packet before logs rotate or consumers change the backlog. Include UTC time, cluster alarm output, filesystem free bytes, queue accumulation, recent broker logs and the publisher’s blocked/timeout evidence. Queue bytes help identify pressure, but they do not authorize deletion.
date -u
sudo rabbitmq-diagnostics -q alarms
sudo rabbitmqctl list_queues -p / name type messages_ready messages_unacknowledged message_bytes_ready consumers --formatter=table
sudo journalctl -u rabbitmq-server --since "-30 min" --no-pager | tail -n 200
Repeat list_queues for each relevant virtual host rather than assuming / owns all work. If the management plane has thousands of queues, use a scoped API or monitoring query instead of repeatedly requesting every entity during the incident; RabbitMQ’s monitoring guidance warns that broad, frequent collection adds its own load.
Application evidence matters just as much. Preserve the last confirmed publish ID, first blocked notification, retry count, client timeout and whether retries are idempotent. Without that boundary, operators can restore the broker and still create duplicates when producers replay messages whose acceptance was uncertain.
Recover headroom without deleting RabbitMQ data
Reduce ingress and keep useful consumers moving
Pause or rate-limit the confirmed producer path first. Consumer-only connections can continue draining ready messages, which is exactly why RabbitMQ preserves them during a resource alarm. Keep publisher retry loops bounded; an aggressive retry storm adds memory, sockets and duplicate risk without bypassing the disk gate.
Logical backlog reduction does not guarantee an immediate matching increase in filesystem free bytes. Queue storage, segment lifecycle and replication can delay physical reclamation, so watch the broker partition and alarm state instead of estimating recovery from message count alone.
Do not stop consumers automatically. Stop a consumer only when its downstream system is unsafe, its acknowledgements are failing, or business ownership requires the backlog to remain untouched. The incident goal is controlled drain, not blind emptying.
Reclaim a safe owner or extend the filesystem
Start with df, then inspect likely owners. A broad du on a very large or busy broker volume can add metadata I/O, so scope it to the database and log paths and run it once.
sudo du -xhd1 /var/log /var/lib/rabbitmq 2>/dev/null | sort -hChoose relief by ownership:
- Rotate or archive confirmed disposable application/host logs under the site’s retention policy.
- Extend the underlying volume and filesystem through the provider/filesystem-specific procedure, with a rollback or snapshot boundary appropriate to that platform.
- When Docker stdout is the competing owner, bound Docker log growth before recreating containers under the new logging policy.
- Move unrelated backups or artifacts only when their recovery policy and destination are verified.
- Require workload-owner approval before purging a queue; purge is data loss, not routine capacity maintenance.
Never delete files inside RabbitMQ’s database directory to make the alarm disappear. Queue segments, quorum state and metadata are broker-owned. Removing them behind RabbitMQ can turn a capacity incident into an unrecoverable data or cluster-consistency incident.
Prove the cluster accepts messages again
RabbitMQ periodically clears the disk alarm after free space rises above the configured limit. Wait for the broker to report that state; do not infer recovery from df alone.
sudo rabbitmq-diagnostics -q alarms
sudo rabbitmq-diagnostics -q check_local_alarms
Then use the real application path or a pre-approved canary to prove all four boundaries:
- Publisher connection is unblocked.
- One uniquely identified message receives a publisher confirm.
- Intended queue depth changes as expected.
- Consumer processes and acknowledges that exact message once.
Cluster recovery also requires every node to stay above its watermark during the test. A short green check followed by another alarm means capacity was only borrowed; leave ingress controlled until the owning disk consumer and growth rate are understood.
Choose a disk limit that survives restart
Derive reserve from the response window
RabbitMQ recommends an absolute watermark because it is easier to reason about, and its documentation presents installed memory as a conservative baseline. Production planning should also cover how much data can arrive before an operator or automation safely reduces ingress.
| Reserve input | How to estimate it | Why it belongs |
|---|---|---|
| Installed memory baseline | Host or container memory available to RabbitMQ and paging behavior | Transient messages can still reach disk under memory pressure |
| Peak broker write demand | Measured bytes per second across representative bursts | Converts workload rate into consumed headroom |
| Response window | Detection, notification and safe mitigation time | The broker must survive until action takes effect |
| Filesystem reserve | Space needed by journal, metadata, logs and maintenance | RabbitMQ is not the only writer on the partition |
Use the larger of the documented conservative memory baseline and a measured reserve such as peak write rate × response seconds + paging burst + filesystem reserve. Add uncertainty for growth, but do not invent a universal percentage that ignores disk size and traffic rate.
Treat the configured disk reserve as unavailable workload space. Size the broker volume from measured ingress, retention, compaction and recovery time rather than from its current queue depth alone.
Persist one absolute value
After the filesystem has real headroom, place the approved value in rabbitmq.conf. The following is an example, not a universal recommendation:
disk_free_limit.absolute = 8GBA runtime rabbitmqctl set_disk_free_limit change lasts only until the next node restart. If an incident required a temporary runtime value, reconcile the configuration deliberately and verify the effective limit after a controlled restart. When both absolute and relative settings exist, current supported RabbitMQ versions prefer the absolute value; remove ambiguity rather than maintaining two competing policies.
FAQ: Decisions during a RabbitMQ disk alarm
Can RabbitMQ be healthy while a disk alarm blocks publishers?
Yes. RabbitMQ can keep its process, CLI and consumer-only deliveries available while disk protection pauses publishing connections. Treat health and writable message acceptance as separate checks, then require a publisher confirm before declaring recovery.
Does one low-disk node block publishers on every cluster node?
Yes. RabbitMQ resource alarms are cluster-wide, so one node below disk_free_limit can block publishers connected through other nodes. Identify and clear the alarm owner on every node rather than restarting the client-facing node.
Will restarting RabbitMQ clear a disk alarm?
No. A restart does not create free filesystem space; the disk monitor will raise the alarm again when the database partition remains below its limit. Restart only for a separate evidence-backed need and preserve the return path first.
Should I lower disk_free_limit to restore publishing quickly?
Lowering disk_free_limit reduces the safety reserve protecting RabbitMQ instead of adding capacity. Normal recovery frees or extends real space, controls producer ingress and then chooses a persistent limit from measured write demand and response time.
Is it safe to delete queue files or purge messages during the alarm?
Do not delete RabbitMQ database files manually. Queue purge is explicit data loss and needs workload-owner approval, a named queue and a recovery decision; prefer bounded ingress, continued safe consumption and filesystem relief from a proven disposable owner.
Monitor the next approach to the watermark
Alert before available meets limit, not only after publisher blocking begins. RabbitMQ recommends Prometheus and Grafana for production monitoring; its detailed metrics endpoint exposes the available bytes and configured low watermark.
rabbitmq_detailed_disk_space_available_bytes
- rabbitmq_detailed_disk_space_available_limit_bytes
Trigger the operational alert when remaining headroom falls below the site’s measured response reserve for a sustained interval. Pair that signal with disk write rate, queue ready bytes, publisher rate, consumer rate and alarm state. A falling margin with growing message_bytes_ready points toward backlog; a falling margin with flat queues points toward another filesystem owner.
Client telemetry closes the observability gap. Count connection.blocked duration, publish-confirm latency, retry volume and unconfirmed message age. Disk metrics say the boundary is near; publisher evidence says whether users are already affected.
Close with an acceptance window, not a green moment
Keep ingress controlled through a representative traffic window and record minimum headroom on every node, peak queue bytes, publisher-confirm latency, consumer acknowledgement, the owner of reclaimed or added capacity, persistent disk_free_limit and the next alert threshold. Include the uncertain-publish reconciliation result so application owners know whether duplicates remain possible.
The incident is closed when all nodes remain above the approved reserve, controlled publishes are confirmed, intended consumers acknowledge them, and the original growth path is bounded or resized. That evidence proves RabbitMQ is writable again; a running process by itself never did.