Lifetime VPS Europe
 Lifetime VPS Asia
 Lifetime WooCommerce Hosting
 Lifetime Hosting
 Lifetime Game Dedicated Servers
 Chicago, US
 Tokyo, Japan
 Singapore
 Hong Kong
 Seoul, South Korea
 Amsterdem, Netherlands
 London, UK
 Stockholm, Sweden
 Oslo, Norway
 Vienna, Austria
 Zurich, Switzerland
 Sydney, Australia
 Wordpress Hosting
 VPS Hosting
 DDOS Protection
 Submit Ticket
 Full Management
 Guides
 Videos and Podcasts
 Discover Creative Ideas
 Voxfor Autonomous AI Workers
 Voxfor Mega Menu
 Voxfor Advanced Price Management For WooCommerce
 Voxfor Secure Live Chat and AI Support
 Voxfor Multilanguage
 Voxfor AI Content Summary
 Voxfor Autopilot

eCommerce ROI (Return on Investment) measures how profitable your online store is based on money spent vs money earned. In other words, it shows whether the revenue you make actually translates into profit after covering all costs. A simple way to define it is: ROI = (Net Profit / Total Investment) × 100. This means you subtract all related expenses from revenue to get net profit, then divide by the investment and convert to a percentage.
For example, if your store generated $10,000 in sales but you spent $8,000 on ads, products, shipping, fees, and other costs, your net profit is $2,000. The ROI is ($2,000 / $8,000) × 100 = 25%. A 25% ROI means you earned 25 cents in profit for every dollar spent. Generally:
- Positive ROI (>0%) means a profitable investment.
- High ROI (e.g. 200%+) is excellent but depends on margins and goals.
- Low ROI (close to 0% or negative) means you’re barely breaking even or losing money.
Improve Your eCommerce ROI with Voxfor Hosting
Your online store ROI depends on more than ads and product pricing. Website speed, uptime, checkout performance, and server reliability all affect conversions, abandoned carts, and customer trust.
ith Voxfor eCommerce Hosting, you get a fast, secure, and scalable hosting environment built for WooCommerce, Magento, and growing online stores. Improve page load speed, handle traffic spikes, protect customer data, and give shoppers a smoother buying experience from product page to checkout.
ROI vs ROAS: Key Differences
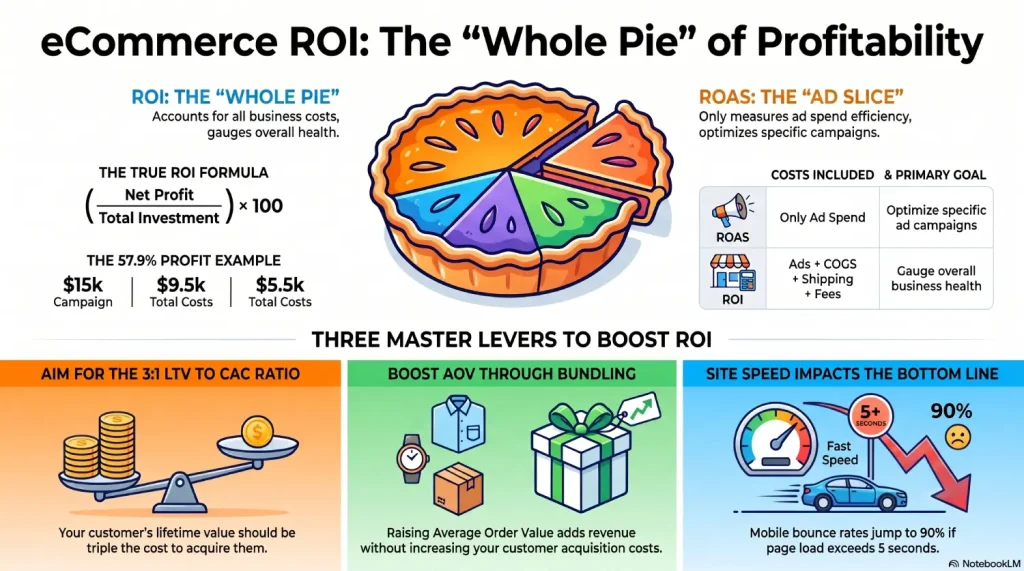
ROI and ROAS (Return on Ad Spend) are both metrics for assessing performance, but they measure different things. In brief:
| Aspect | ROI (Return on Investment) | ROAS (Return on Ad Spend) |
|---|---|---|
| Definition | Profit percentage from total investments | Revenue generated per dollar of ad spend |
| Formula | ROI = (Net Profit / Total Cost) × 100 (uses net profit, including all costs) | ROAS = Revenue_from_Ads / Ad_Spend (uses ad revenue vs ad cost) |
| Focus | Overall profitability (accounts for all costs and profits) | Ad campaign efficiency (only ad spend vs revenue) |
| Costs Included | All cost factors: product cost, marketing, shipping, fees, tools, labor, returns, etc. | Only the ad budget (marketing spend) |
| Use Case | Gauge overall business health and scalable profit | Compare/optimize specific ad campaigns or channels |
As Triple Whale notes, ROI is the “whole pie” perspective on profitability, while ROAS is just the ad slice. For example, a ROAS of 4× (i.e. $4 revenue for every $1 ad spend) may look good, but it doesn’t account for product costs, shipping, processing fees, and other overhead. After deducting those, the actual profit (and thus ROI) may be much lower. Conversely, ROI tells you if overall marketing and operations are profitable. In practice, use ROAS to optimize ads, but track ROI to ensure your marketing spend leads to real profit.
Calculating eCommerce ROI
To calculate ROI correctly, use this step-by-step approach:
1. Identify all revenues from the period or campaign you’re measuring. This is total sales (order value, including taxes or not depending on your calculation).
2. Identify all relevant costs (total investment) needed to generate those sales. Common costs to include are listed below.
3. Compute Net Profit = (Revenue – Total Investment).
4. Apply the ROI formula: ROI = (Net Profit / Total Investment) × 100%.
For clarity, here is the ROI formula:
ROI = (Net Profit / Total Investment) × 100
where Net Profit = Revenue – Total Investment.
A worked example: suppose an ad campaign brings in $12,000 in sales. The business spent $3,000 on ads, plus $4,000 on product costs, $1,000 on shipping/fulfillment, $500 on payment fees, and $500 on tools/creative. Total Investment = $3,000 + $4,000 + $1,000 + $500 + $500 = $9,000. Net Profit = $12,000 – $9,000 = $3,000. Then ROI = ($3,000 / $9,000) × 100 = 33.3%. This means the campaign generated 33% more profit than its cost.
Table: Costs to Include in ROI Calculation
It’s crucial to include all costs when computing ROI, otherwise you’ll overestimate profitability. The table below lists major cost categories you should account for:
| Cost Category | Examples / Details |
|---|---|
| Product Costs (COGS) | Manufacturing or purchase cost of goods sold |
| Marketing & Advertising | Google Ads, Meta ads, SEO agency, influencer fees, affiliate commissions, etc. |
| Shipping & Fulfillment | Courier fees, packaging materials, warehousing, pick/pack labor, return shipping costs |
| Payment Processing & Platform Fees | Stripe/PayPal fees, eCommerce platform fees (Shopify, WooCommerce plugins) |
| Tools and Software | Analytics software, email marketing tools, CRO tools, payment gateways subscriptions |
| Staff and Agency | Wages or contractor fees for marketing, customer support, content creation, etc. |
| Returns & Refunds | Cost of returned goods, restocking, refunds issued, and handling returned items |
| Discounts & Fees | Coupon discounts, transaction fees, chargebacks, and any promotional costs |
| Overhead (if allocating) | A portion of overhead like office, utilities (often excluded from single campaign ROI) |
A concise checklist: include every expense tied to generating those sales. As Conversios explains, a “complete ROI calculation should include all related costs” (ad spend, software, creative, agency fees, salaries, discounts, influencer/affiliate payouts, etc.). Neglecting hidden costs (like software or salaries) will make your ROI appear artificially high.
Example: ROI Calculation
Let’s illustrate with a numeric example to ensure clarity:
- Campaign Revenue: $15,000
- Ad Spend: $2,000 (Google Ads)
- Product Cost (COGS): $5,000
- Shipping & Handling: $1,500
- Transaction & Processing Fees: $400
- Software/Creative: $600
Total Investment: $2,000 + $5,000 + $1,500 + $400 + $600 = $9,500.
Net Profit: $15,000 – $9,500 = $5,500.
ROI: ($5,500 / $9,500) × 100 ≈ 57.9%.
This 57.9% ROI means the campaign generated $0.579 profit per dollar spent. It’s profitable, but whether it’s “good” depends on your margins and goals (see below).
What is a Good eCommerce ROI?
There’s no one-size-fits-all “good” ROI in eCommerce, since it depends on your profit margins, industry, business model, and growth stage. However, some general guidelines help:
- Marketing ROI benchmarks: Many businesses aim for at least 2:1 to 3:1 ROI (200%–300%) on marketing campaigns, meaning $2–$3 revenue per $1 spent, though higher is better. Exceptionally, email marketing often sees ~3600% ROI (i.e. $36 for each $1 spent) due to low marginal cost.
- Channel variation: Paid ads might target 100%–300% ROI; SEO/organic might yield 250%–500% ROI over a longer term; affiliate programs often see 200%–400% ROI. These depend on margin and competition.
- CAC vs LTV ratio: A healthy LTV:CAC ratio is often cited around 3:1. That means a customer’s lifetime value should be about 3 times the cost of acquiring them. If LTV:CAC is much lower, ROI will likely suffer.
In practice, a “good” ROI is one that covers all your costs and leaves sustainable profit for reinvestment and growth. High-margin businesses can tolerate higher marketing costs (lower ROI) because each customer is very valuable over time. Low-margin businesses must squeeze ROI higher to survive. Focus on whether your ROI enables growth: if more sales cost too much, ROI will drop even if revenue climbs.
Key Metrics That Affect eCommerce ROI
Several performance metrics directly influence ROI. Track and optimize these:
- Customer Acquisition Cost (CAC): The average marketing/sales cost to get one new customer. Formula: CAC = (Total Sales & Marketing Spend) / (New Customers Acquired). Lowering CAC improves ROI because you spend less to gain each customer. (See strategies below.)
- Customer Lifetime Value (LTV/CLV): The total profit a customer generates over their lifetime. A simple formula is LTV = AOV × Purchase Frequency × Customer Lifespan. For example, if AOV=$100, purchase freq=3/year, lifespan=2 years, LTV=$600. A higher LTV means you can spend more to acquire customers without harming ROI.
- LTV:CAC Ratio: This compares customer value to acquisition cost. For instance, Shopify notes an ideal LTV:CAC is around 3:1. A ratio below 1:1 means you’re losing money on customers; 3:1 or above indicates sustainable profitability.
- Average Order Value (AOV): Average spend per order. Formula: AOV = Total Revenue / Total Orders. If your store makes $100,000 on 1,000 orders, AOV is $100. Increasing AOV (through bundles, upsells, etc.) raises revenue without extra acquisition cost, boosting ROI.
- Conversion Rate (CR): The percentage of visitors who complete a purchase. Formula: CR = (Purchases / Visitors) × 100%. E-commerce averages around 2.5–3% globally, varying by industry. Improving CR means more sales from the same traffic, directly improving ROI.
- Cart Abandonment Rate: The share of shoppers who start checkout but don’t finish. Baymard Institute reports an average abandonment rate of about 70.2%. High abandonment means you’re losing many potential sales. Lowering it recovers revenue with minimal extra cost.
- Return/Refund Rate: The percentage of orders returned by customers. Industry average return rate is roughly 17% (with higher peaks in apparel). Returns not only reduce revenue but incur reverse-shipping and restocking costs, hurting ROI. Reducing returns (via accurate descriptions and sizes) preserves profit.
- Gross Profit Margin: Measures how much revenue remains after covering COGS. Formula: Gross Margin % = (Revenue – COGS) / Revenue × 100. Higher margins (i.e. lower COGS) leave more room for advertising and other costs while still yielding profit. If margins are low, even high sales may not produce strong ROI.
Tracking these KPIs helps identify where ROI is weak. For example, if CAC is rising, focus on better targeting or cheaper channels. If return rate spikes, inspect product quality or sizing. As one benchmark, Shopify notes CAC can range from $127 to $462 depending on industry, reinforcing that LTV should be ~3× higher to stay profitable. Use analytics (e.g. GA4 ecommerce events) to monitor each metric and tie them back to ROI.
How to Improve eCommerce ROI: 12+ Strategies
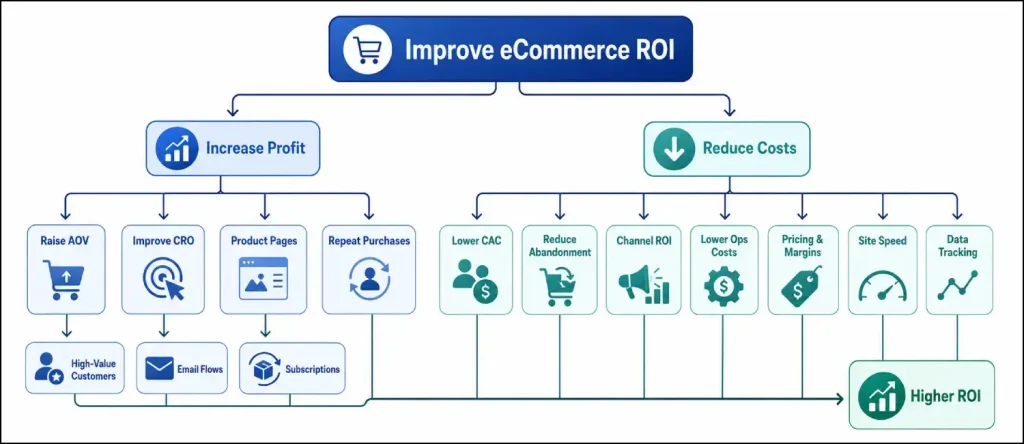
Improving ROI means either increasing profit (numerator) or reducing investment (denominator). Here are 12 actionable tactics across marketing, UX, and operations:
- Lower Customer Acquisition Cost (CAC): Spend more efficiently to attract customers. For example, refine ad targeting (exclude low-value audiences), test different ad creatives, use lookalike audiences, or shift budget to lower-cost channels. Investing in SEO and content marketing builds free organic traffic, reducing reliance on paid ads over time. Consider referral or affiliate programs to bring in customers cheaply. (Lowering CAC by even $10 per customer can save thousands annually.)
- Raise Average Order Value (AOV): Encourage customers to spend more per order. Common methods: bundle complementary products; upsell add-ons on product pages; offer “frequently bought together” discounts; implement tiered pricing or volume discounts (e.g. “Buy 2 get 10% off”); and set a free-shipping threshold just above your current AOV to nudge bigger carts. For example, if AOV is $80, raising it to $100 adds $20 per order without any extra ad spend. For 1,000 orders/month, that’s $20,000 more revenue (most of it profit).
- Improve Conversion Rate (CRO): Convert more visitors into buyers. Techniques include: using high-quality product images and video, writing clear benefit-focused descriptions, showing trust badges and reviews, simplifying navigation, and ensuring a mobile-friendly design. Streamline checkout by reducing form fields, offering guest checkout, and displaying clear shipping costs. Even a 0.5% lift in conversion can significantly boost sales (e.g. going from 2% to 2.5% on 50,000 visitors means 250 extra orders).
- Reduce Cart Abandonment: Recover would-be lost sales. Common fixes: add exit-intent pop-ups offering a small discount, send automated abandoned-cart emails or SMS reminders, and display free or flat-rate shipping options early. Remove friction by offering multiple payment methods (PayPal, Apple Pay, Klarna, etc.), and show trust/security seals. Baymard data shows a 70% abandonment rate, so recovering even a fraction of those can substantially raise ROI.
- Optimize Product Pages: The final decision happens on product pages. Include persuasive copy that highlights benefits, multiple product images from different angles, zoom/360° views, size guides, and clear shipping/return info. Incorporate user reviews and Q&A to build trust. Avoid ambiguous language; be upfront about costs and policies. A well-crafted product page reduces hesitation, increases conversion, and lowers returns (by setting correct expectations).
- Increase Repeat Purchases (Retention): It costs less to retain customers than acquire new ones. Build loyalty and repeat business by: email campaigns (post-purchase follow-ups with reorder reminders or related product suggestions), loyalty programs or points systems, subscription offerings (for consumables), and occasional perks for returning customers (birthday discounts, member sales). Segment your email list to re-market to past buyers. For example, Shopify reports 3,600% ROI from email marketing; every retained customer boosts lifetime value and ROI.
- Optimize Marketing Channels: Not all channels yield the same ROI. Analyze ROI by channel (organic, paid search, paid social, email, affiliate, influencer, marketplaces, etc.). Shift budget from underperforming channels to those with higher ROI. For instance, if Facebook ads have low ROI but email has high ROI, focus on growing your email list. Use UTM tracking and analytics to attribute revenue accurately. Focusing on profitable channels allows scaling marketing spend while maintaining ROI.
- Lower Operational/Overhead Costs: Review all operational expenses related to orders. This could include negotiating better shipping or fulfillment rates, switching to more cost-effective packaging suppliers, or automating manual tasks. Even reducing warehouse or labor costs per order can improve net profit. Minimize hidden fees: for example, optimize tax collection, reduce payment disputes/chargebacks, and avoid unnecessary software subscriptions.
- Improve Pricing and Margins: Sometimes improving ROI is about price, not spend. Evaluate if products are underpriced relative to market value. Small price increases (especially on unique or in-demand items) can significantly boost margins. Also, consider “premium” versions of products or premium shipping options for extra fee. Ensure heavy discounts or free shipping offers are balanced against the profit they sacrifice. Higher margins mean each sale contributes more to profit, raising ROI.
- Website Performance & UX: A slow or unreliable site can kill conversions (and waste ad clicks). Optimize page load speed by using fast hosting (cloud or high-performance eCommerce hosts), a CDN for static assets, compressed images, and clean code. Google found that 53% of mobile visitors will leave a site that takes longer than 3 seconds to load; at 5 seconds, bounce probability is 90%. Faster sites retain customers better, improving conversion rates and ROI. Test checkout speed regularly and fix any friction or errors.
- Use Email Automation Flows: Automate email sequences that target key moments: welcome series for new subscribers, abandoned-cart reminders, browse abandonment (products viewed but not purchased), post-purchase “thank you” and cross-sell emails, and win-back campaigns for lapsed customers. These run on autopilot and have high ROI because they target warm leads. For instance, abandoned cart emails can recover a significant percentage of lost sales without extra ad spend.
- Data Tracking & Optimization: Implement proper analytics (e.g. GA4 Enhanced Ecommerce events) to measure every stage of the funnel. Use A/B testing on landing pages, product pages, and checkout steps to gradually improve performance (just ensure your testing tools don’t slow down the site). Analyze which products, categories, or segments are most profitable and promote those. Make decisions based on data, not guesswork.
- Focus on High-Value Customers/Products: Allocate more marketing towards products with higher margins or repeat-buy potential. Similarly, target customer segments with historically high LTV. For example, if you have 20% of customers that produce 80% of revenue, invest in upselling or rewarding them. Pausing ads for low-margin products can improve overall ROI.
- Subscription & Bundling: If applicable, introduce subscription models (e.g. monthly shipments of consumables) to lock in customer value. Bundling related items encourages larger purchases and reduces per-item marketing cost. This ties into AOV strategies but deserves explicit mention for subscription-based eCommerce.
Each strategy above is actionable. For example, one store raised AOV by 15% (through bundles and free-shipping thresholds), increasing monthly revenue by six figures without additional ad spend. Combine multiple tactics (lower CAC and raise AOV and boost conversion) for multiplicative effects on ROI.
ROI Improvement Flowchart
Below is a visual flow of the key steps to calculate ROI and implement improvements. This mermaid chart outlines how to gather data, compute ROI, and then apply the strategies listed above:
flowchart LR
    A[Gather Data: Revenue & Costs] --> B[Compute Net Profit (Revenue - All Costs)]
    B --> C[Calculate ROI = (Net Profit / Total Costs)×100]
    C --> D[Analyze ROI vs Goals]
    D --> E{ROI Meets Goal?}
    E -- Yes --> F[Scale Profitably: Maintain/Increase Spend]
    E -- No --> G[Identify Weak Points and Improve]
    G --> H[Lower CAC]
    G --> I[Increase AOV]
    G --> J[Improve Conversion Rate]
    G --> K[Reduce Abandonment & Returns]
    G --> L[Optimize Pricing & Margins]
    G --> M[Enhance UX/Speed]
    G --> N[Focus on High-LTV Segments]
    F --> Z[Continue Monitoring]
    N --> Z
    M --> Z
    L --> Z
    K --> Z
    J --> Z
    I --> Z
    H --> Z
ROI Improvement Checklist
Before implementing changes, run through this quick checklist to ensure you’re covering all bases:
- Are you calculating ROI using profit (net profit), not just revenue? (Include costs.)
- Have you accounted for all relevant costs: ads, COGS, shipping, fees, software, returns, etc.
- Do you know your CAC and how to reduce it?
- Have you measured Average Order Value and ways to increase it?
- Do you know your store’s conversion rate and how to improve CRO?
- Are you tracking cart abandonment and using recovery tactics?
- Are return rates hurting profit? Can you clarify sizing/descriptions?
- Do you segment and retain customers (boosting LTV)?
- Are you investing more in channels with higher ROI?
- Is your website fast and user-friendly (mobile checkout, page speed)?
- Are you using email flows to recover sales and upsell?
- Are you analyzing data regularly (Google Analytics, A/B tests)?
If you can’t answer “yes” clearly, work on that area. Each unchecked item is a potential leak in profit.
Final Thoughts
eCommerce ROI is the ultimate litmus test for your store health. You might see rising sales numbers, but if ROI is flat or negative, your business isn’t really winning. Always measure ROI by comparing profit to spend, not just revenue. Focus on the levers that move ROI: lower acquisition costs, higher order values, better conversion, and tighter cost control. Remember that technical factors like site speed and reliability also affect ROI, Google found that mobile users are 32% more likely to bounce at just 3s page load and 90% bounce at 5s. Optimizing your store’s performance (fast hosting, efficient checkout) can directly improve conversion and ROI.
By systematically tracking these metrics and applying the strategies above, you can turn a high-traffic store into a high-profit store. Start with one area, for example, improving conversion or reducing CAC, and measure the ROI impact. Over time, your efforts compound, leading to a more profitable, sustainable eCommerce business.
If your ROI is lower than it should be, remember: it’s not just about more traffic. It’s about better quality traffic, better conversions, and smarter spending. Tools like Google Analytics (Enhanced Ecommerce) and ROI calculators can guide decisions. And on the technical side, consider upgrading to a high-performance eCommerce hosting or caching solution to ensure visitors have a lightning-fast, secure shopping experience. (Even a 1-second improvement in load time can boost conversions noticeably.)
Take control of your eCommerce ROI today: measure rigorously, cut waste, and optimize for profit at every step.
Frequently Asked Questions (FAQs)
About the writer

Hassan Tahir wrote this article, drawing on his experience to clarify WordPress concepts and enhance developer understanding. Through his work, he aims to help both beginners and professionals refine their skills and tackle WordPress projects with greater confidence.