Lifetime VPS Europe
 Lifetime VPS Asia
 Lifetime WooCommerce Hosting
 Lifetime Hosting
 Lifetime Game Dedicated Servers
 Chicago, US
 Tokyo, Japan
 Singapore
 Hong Kong
 Seoul, South Korea
 Amsterdem, Netherlands
 London, UK
 Stockholm, Sweden
 Oslo, Norway
 Vienna, Austria
 Zurich, Switzerland
 Sydney, Australia
 Wordpress Hosting
 VPS Hosting
 DDOS Protection
 Submit Ticket
 Full Management
 Guides
 Videos and Podcasts
 Discover Creative Ideas
 Voxfor Autonomous AI Workers
 Voxfor Mega Menu
 Voxfor Advanced Price Management For WooCommerce
 Voxfor Secure Live Chat and AI Support
 Voxfor Multilanguage
 Voxfor AI Content Summary
 Voxfor Autopilot
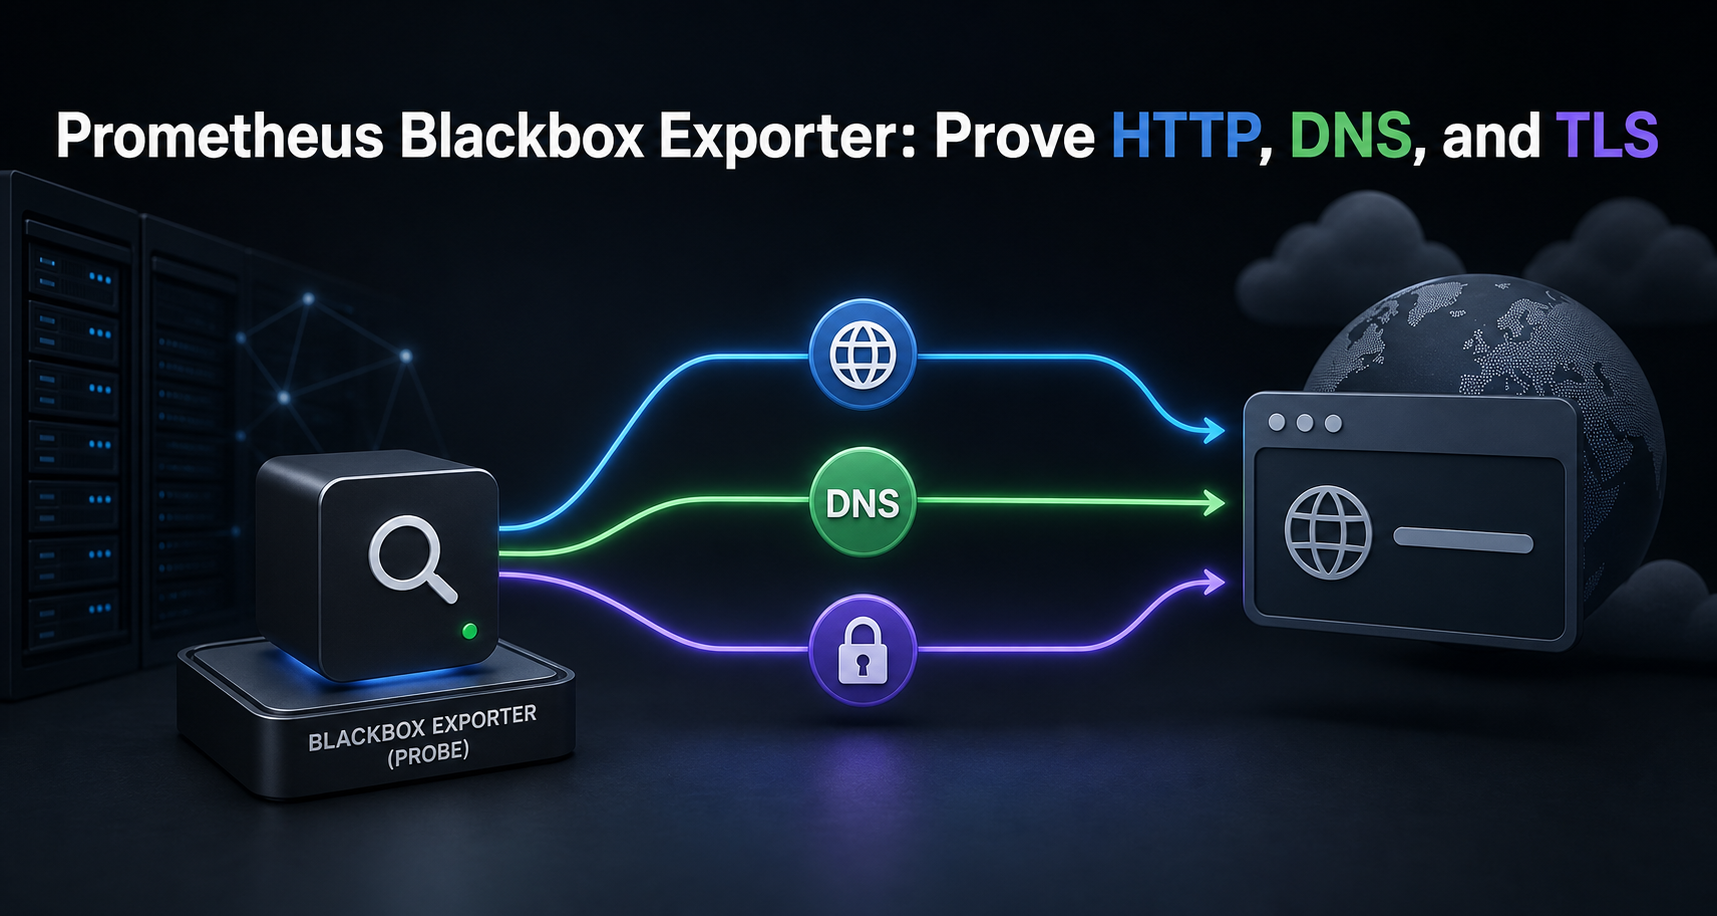
A green probe can still prove the wrong thing. An HTTP request may return 200 while serving an error page, a DNS server may answer while returning the wrong record, and a TLS handshake may succeed with a certificate that expires next week. Blackbox monitoring becomes useful only when each probe has an explicit contract.
This how-to builds three separate contracts with Prometheus Blackbox Exporter: an HTTP body marker, an exact DNS answer, and HTTPS with a trusted certificate plus an expiry metric. A disposable loopback lab then proves all three through Prometheus and intentionally fires a certificate-expiry alert. The result is external evidence you can interpret, not one ambiguous uptime light.
Linux operators and developers who can run shell commands and edit YAML are the target readers. Prometheus expertise is not required, but you should know which endpoints you are authorized to probe. The reproduced path uses Debian 13, Blackbox Exporter 0.28.0, Prometheus 3.13.2, OpenSSL 3.5.6, and dnsmasq 2.91 as tested on August 9, 2026.
One Green Result Needs One Named Contract
Blackbox Exporter sends requests from outside an application’s code path. That makes it valuable for observing what a network client can reach, but it does not automatically understand business correctness. probe_success=1 means the selected module’s configured conditions passed.
Define the contract before selecting metrics:
| Contract | Controlled input | Success evidence | Failure owner to investigate first |
|---|---|---|---|
| HTTP response | URL, method, status, required body marker | probe_success 1, expected status, marker matched |
reverse proxy or application response path |
| DNS answer | DNS server, query name/type, RCODE, expected RR | success plus exact answer validation | authoritative/recursive DNS path used by the probe |
| TLS endpoint | HTTPS URL, trust roots, hostname, minimum policy | success plus future probe_ssl_earliest_cert_expiry |
certificate chain, hostname, listener, SNI or renewal deployment |
Simple uptime checks remain useful, but a real customer path may include login, checkout, queues, email, and state changes. Use customer-journey monitoring design when an HTTP marker cannot represent the outcome customers need.
Build Controlled Endpoints Before Writing Alerts
Public targets are convenient for a first curl, yet they can change status, DNS, certificates, or rate limits without your control. A local fixture lets the configuration fail for known reasons and keeps the lab away from production data.
Acquire pinned binaries inside a guarded directory
Start by creating one random temporary root, installing only the DNS fixture package, downloading two upstream archives, verifying their published SHA-256 entries, and recording versions. Recheck the upstream release pages before copying these pins into a long-lived deployment.
set -euo pipefail

export LAB_ROOT="$(mktemp -d /tmp/voxfor-blackbox-lab.XXXXXX)"
export BLACKBOX_VERSION="0.28.0"
export PROMETHEUS_VERSION="3.13.2"
export BLACKBOX_PORT="19115"
export PROMETHEUS_PORT="19090"

sudo apt-get update
sudo apt-get install -y curl jq openssl python3 dnsmasq-base
cd "$LAB_ROOT"

BB_ARCHIVE="blackbox_exporter-${BLACKBOX_VERSION}.linux-amd64.tar.gz"
PROM_ARCHIVE="prometheus-${PROMETHEUS_VERSION}.linux-amd64.tar.gz"
curl -fsSLO "https://github.com/prometheus/blackbox_exporter/releases/download/v${BLACKBOX_VERSION}/${BB_ARCHIVE}"
curl -fsSLo blackbox-sha256sums.txt "https://github.com/prometheus/blackbox_exporter/releases/download/v${BLACKBOX_VERSION}/sha256sums.txt"
grep " ${BB_ARCHIVE}$" blackbox-sha256sums.txt | sha256sum -c -
curl -fsSLO "https://github.com/prometheus/prometheus/releases/download/v${PROMETHEUS_VERSION}/${PROM_ARCHIVE}"
curl -fsSLo prometheus-sha256sums.txt "https://github.com/prometheus/prometheus/releases/download/v${PROMETHEUS_VERSION}/sha256sums.txt"
grep " ${PROM_ARCHIVE}$" prometheus-sha256sums.txt | sha256sum -c -
tar -xzf "$BB_ARCHIVE"
tar -xzf "$PROM_ARCHIVE"

export BB="$LAB_ROOT/blackbox_exporter-${BLACKBOX_VERSION}.linux-amd64/blackbox_exporter"
export PROM="$LAB_ROOT/prometheus-${PROMETHEUS_VERSION}.linux-amd64/prometheus"
export PROMTOOL="$LAB_ROOT/prometheus-${PROMETHEUS_VERSION}.linux-amd64/promtool"
"$BB" --version 2>&1 | head -n 1
"$PROM" --version | head -n 1
Version pins make the receipt reproducible; checksums make acquisition fail closed. Blackbox Exporter’s current upstream README documents the supported probers, /probe, debug=true, reload behavior, and multi-target pattern.
Create HTTP, HTTPS, and DNS fixtures
Controlled loopback fixtures serve the same VOXFOR_PROBE_OK marker over plain HTTP and locally trusted HTTPS. The leaf certificate lasts 14 days so a 21-day warning should fire. dnsmasq answers only the synthetic name used by the DNS module. Every listener binds to loopback.
set -euo pipefail
: "${LAB_ROOT:?Run the acquisition block first}"
cd "$LAB_ROOT"

mkdir -p fixture/www fixture/tls prometheus-data
printf 'VOXFOR_PROBE_OK\n' > fixture/www/index.html
openssl req -x509 -newkey rsa:2048 -nodes -days 30 -subj '/CN=Blackbox Lab CA' -keyout fixture/tls/ca.key -out fixture/tls/ca.crt
openssl req -newkey rsa:2048 -nodes -subj '/CN=127.0.0.1' -addext 'subjectAltName=IP:127.0.0.1' -keyout fixture/tls/server.key -out fixture/tls/server.csr
printf '%s\n' 'subjectAltName=IP:127.0.0.1' 'extendedKeyUsage=serverAuth' > fixture/tls/server.ext
openssl x509 -req -days 14 -sha256 -in fixture/tls/server.csr -CA fixture/tls/ca.crt -CAkey fixture/tls/ca.key -CAcreateserial -extfile fixture/tls/server.ext -out fixture/tls/server.crt

cat > fixture/http_https.py <<'PY'
import http.server, ssl, sys, threading
root, http_port, https_port, cert, key = sys.argv[1:]
handler = lambda *a, **kw: http.server.SimpleHTTPRequestHandler(*a, directory=root, **kw)
plain = http.server.ThreadingHTTPServer(("127.0.0.1", int(http_port)), handler)
secure = http.server.ThreadingHTTPServer(("127.0.0.1", int(https_port)), handler)
context = ssl.SSLContext(ssl.PROTOCOL_TLS_SERVER)
context.load_cert_chain(cert, key)
secure.socket = context.wrap_socket(secure.socket, server_side=True)
threading.Thread(target=plain.serve_forever, daemon=True).start()
secure.serve_forever()
PY

python3 fixture/http_https.py fixture/www 18080 18443 fixture/tls/server.crt fixture/tls/server.key > fixture/http.log 2>&1 &
echo $! > fixture-http.pid
dnsmasq --no-daemon --keep-in-foreground --bind-interfaces --listen-address=127.0.0.1 --port=15353 --no-resolv --address=/health.voxfor.test/192.0.2.10 > fixture/dns.log 2>&1 &
echo $! > fixture-dns.pid
Private keys remain disposable and never leave the guarded directory. Production probes should use real trust stores and secret management rather than placing passwords or bearer tokens directly in broadly readable YAML.
Give Every Module a Failure Meaning
One module checks status plus body, another requires TLS and trusts only the disposable CA, and the DNS module accepts one name, type, RCODE, and answer. This is the point where probe_success receives its meaning.
modules:
  http_marker:
    prober: http
    timeout: 1s
    http:
      preferred_ip_protocol: ip4
      valid_status_codes: [200]
      fail_if_body_not_matches_regexp: [VOXFOR_PROBE_OK]
  https_local_ca:
    prober: http
    timeout: 1s
    http:
      preferred_ip_protocol: ip4
      valid_status_codes: [200]
      fail_if_not_ssl: true
      fail_if_body_not_matches_regexp: [VOXFOR_PROBE_OK]
      tls_config:
        ca_file: /tmp/voxfor-blackbox-lab.REPLACE/fixture/tls/ca.crt
  dns_exact_a:
    prober: dns
    timeout: 1s
    dns:
      preferred_ip_protocol: ip4
      transport_protocol: udp
      query_name: health.voxfor.test
      query_type: A
      valid_rcodes: [NOERROR]
      validate_answer_rrs:
        fail_if_not_matches_regexp:
          - 'health\.voxfor\.test\.\s+.*\s+IN\s+A\s+192\.0\.2\.10'
Save that as $LAB_ROOT/blackbox.yml, replacing /tmp/voxfor-blackbox-lab.REPLACE with printf '%s' "$LAB_ROOT". The exact fields come from Blackbox Exporter’s current module schema. Robust Perception’s DNS prober example also demonstrates why answer-RR validation is stronger than merely receiving a DNS packet.
DNS availability is broader than one successful query. Authoritative independence, zone convergence, registrar dependencies and TCP fallback remain design concerns; secondary-DNS failure-domain planning covers that larger outcome.
Test the Exporter Before Adding Prometheus
Start Blackbox Exporter on loopback and call /probe directly. This divides two failure owners: if direct probes fail, fix the module or endpoint; if they pass but Prometheus has no series, inspect scrape routing.
set -euo pipefail
: "${BB:?Run the acquisition block first}"
cd "$LAB_ROOT"
sed -i "s#/tmp/voxfor-blackbox-lab.REPLACE#$LAB_ROOT#" blackbox.yml
"$BB" --config.file="$LAB_ROOT/blackbox.yml" --web.listen-address="127.0.0.1:${BLACKBOX_PORT}" > blackbox.log 2>&1 &
echo $! > blackbox.pid

until curl -fsS "http://127.0.0.1:${BLACKBOX_PORT}/-/healthy" >/dev/null; do sleep 0.25; done
probe() { curl -fsSG "http://127.0.0.1:${BLACKBOX_PORT}/probe" --data-urlencode "module=$1" --data-urlencode "target=$2"; }
probe http_marker 'http://127.0.0.1:18080/' > http.prom
probe https_local_ca 'https://127.0.0.1:18443/' > https.prom
probe dns_exact_a '127.0.0.1:15353' > dns.prom
grep -E '^(probe_success|probe_http_status_code|probe_ssl_earliest_cert_expiry) ' http.prom https.prom dns.prom
Add debug=true to a manual /probe request when a module returns zero. The upstream project maintains separate application and prober logs, so a scrape failure can be traced without raising global log volume indefinitely.
TLS expiry is only one certificate question. If renewal says success while a proxy, CDN, or another listener still serves old material, use live TLS certificate mismatch diagnosis against each public path.
Route Targets Through Prometheus Without Losing Identity
Prometheus uses its multi-target exporter pattern for Blackbox probes: it sends a target as the target query parameter, keeps that value as the instance label, and replaces the actual scrape address with Blackbox Exporter. Without those relabel steps, Prometheus either scrapes the target’s metrics path or labels every result as the exporter.
global:
  scrape_interval: 2s
  scrape_timeout: 1500ms
  evaluation_interval: 1s
rule_files: [blackbox.rules.yml]
scrape_configs:
  - job_name: blackbox-http-contract
    metrics_path: /probe
    params: {module: [http_marker]}
    static_configs: [{targets: ['http://127.0.0.1:18080/']}]
    relabel_configs:
      - {source_labels: [__address__], target_label: __param_target}
      - {source_labels: [__param_target], target_label: instance}
      - {target_label: __address__, replacement: '127.0.0.1:19115'}
  - job_name: blackbox-https-contract
    metrics_path: /probe
    params: {module: [https_local_ca]}
    static_configs: [{targets: ['https://127.0.0.1:18443/']}]
    relabel_configs:
      - {source_labels: [__address__], target_label: __param_target}
      - {source_labels: [__param_target], target_label: instance}
      - {target_label: __address__, replacement: '127.0.0.1:19115'}
  - job_name: blackbox-dns-contract
    metrics_path: /probe
    params: {module: [dns_exact_a]}
    static_configs: [{targets: ['127.0.0.1:15353']}]
    relabel_configs:
      - {source_labels: [__address__], target_label: __param_target}
      - {source_labels: [__param_target], target_label: instance}
      - {target_label: __address__, replacement: '127.0.0.1:19115'}
Write this file to $LAB_ROOT/prometheus.yml. Prometheus’s multi-target exporter guide explains the relabeling pattern independently of this fixture.
Keep labels bounded when many endpoints are added. A target URL, module, environment, and prober location are useful; unbounded request IDs or user values are not. Prometheus label-cardinality diagnosis shows how to find the label that multiplies a series set after growth begins.
Reachability and expiry also deserve separate rules:
groups:
  - name: blackbox-contract
    rules:
      - alert: BlackboxProbeFailed
        expr: probe_success == 0
        for: 1m
        labels: {severity: page}
        annotations:
          summary: 'External contract failed for {{ $labels.instance }}'
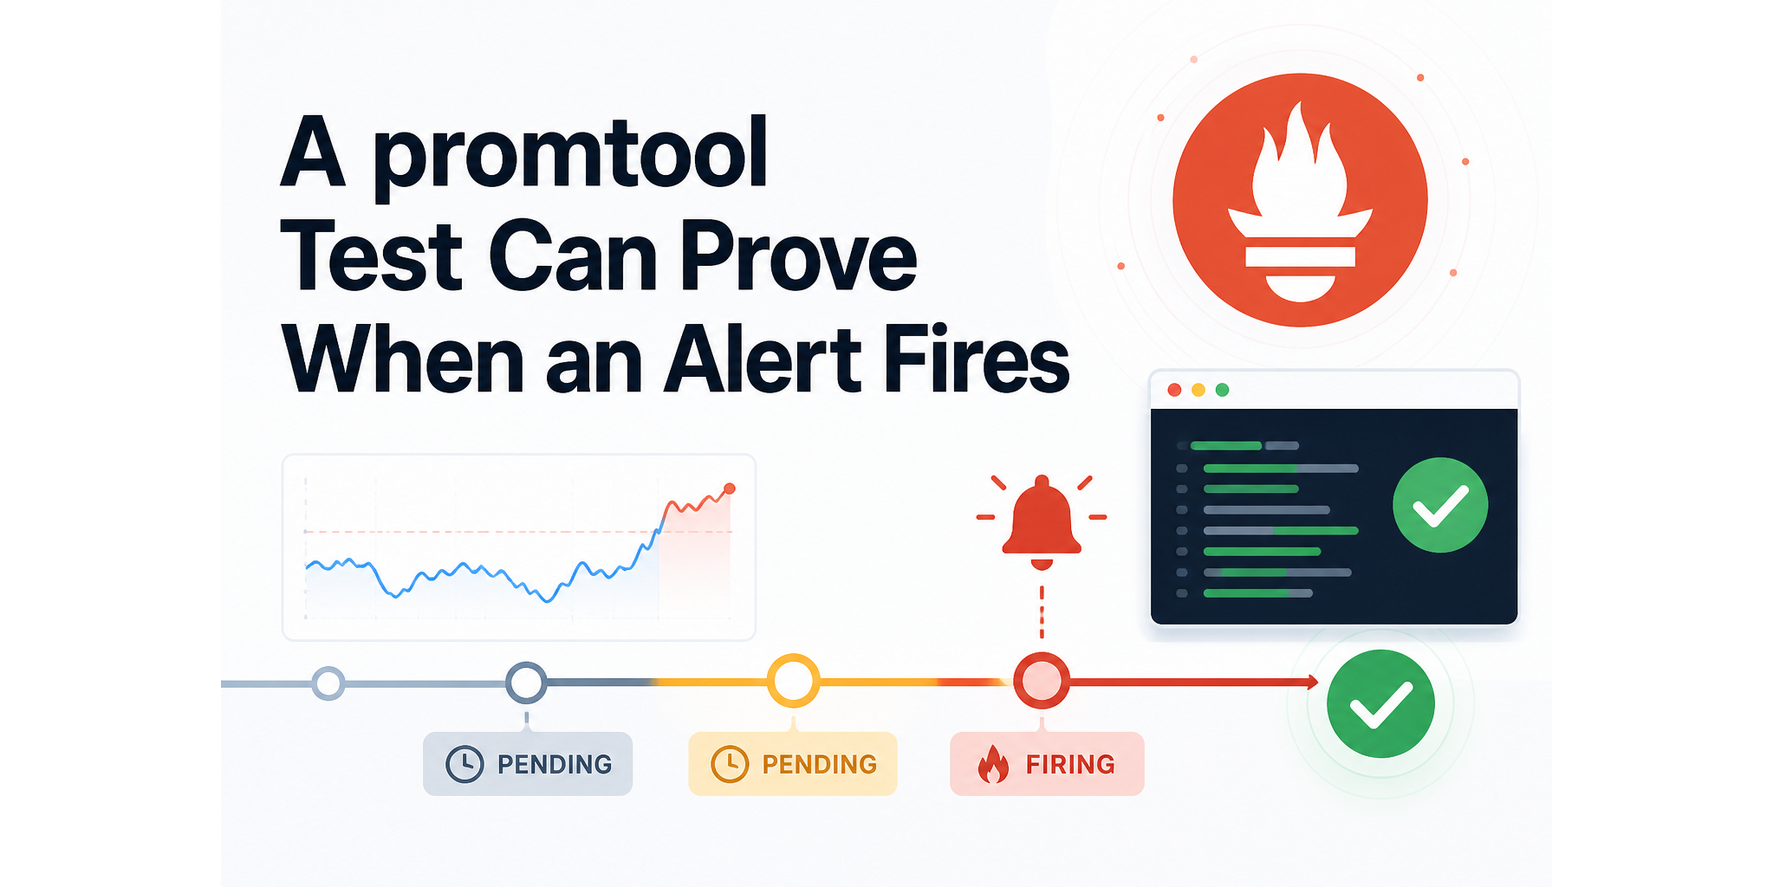
      - alert: BlackboxTLSExpiresSoon
        expr: (probe_ssl_earliest_cert_expiry - time()) < 21 * 24 * 3600 and probe_success == 1
        labels: {severity: ticket}
        annotations:
          summary: 'TLS certificate expires within 21 days for {{ $labels.instance }}'
Store these rules in $LAB_ROOT/blackbox.rules.yml. A failed probe series and a missing series are not equivalent. Apply missing-series and evaluation-error policy when routing alert states, because silence from the prober can otherwise look healthier than an explicit zero.
Require a Three-Series Receipt and One Firing Alert
Validate both YAML files before starting Prometheus. The live query should return three successes with distinct jobs and targets, while the intentionally short certificate should make the expiry alert fire.
set -euo pipefail
cd "$LAB_ROOT"
"$PROMTOOL" check config prometheus.yml
"$PROMTOOL" check rules blackbox.rules.yml
"$PROM" --config.file="$LAB_ROOT/prometheus.yml" --storage.tsdb.path="$LAB_ROOT/prometheus-data" --web.listen-address="127.0.0.1:${PROMETHEUS_PORT}" > prometheus.log 2>&1 &
echo $! > prometheus.pid

until curl -fsS "http://127.0.0.1:${PROMETHEUS_PORT}/-/ready" >/dev/null; do sleep 0.25; done
sleep 5
curl -fsSG "http://127.0.0.1:${PROMETHEUS_PORT}/api/v1/query" --data-urlencode 'query=probe_success' | jq -c '.data.result | map({job:.metric.job,instance:.metric.instance,value:.value[1]}) | sort_by(.job)'
curl -fsSG "http://127.0.0.1:${PROMETHEUS_PORT}/api/v1/query" --data-urlencode 'query=(probe_ssl_earliest_cert_expiry - time()) / 86400' | jq -c '.data.result | map({instance:.metric.instance,days:(.value[1]|tonumber|floor)})'
curl -fsS "http://127.0.0.1:${PROMETHEUS_PORT}/api/v1/alerts" | jq -c '.data.alerts | map({name:.labels.alertname,state:.state,instance:.labels.instance})'
Representative output from the reproduced lab:
{
  "tested_at_utc": "2026-08-09T17:14:52Z",
  "environment": "Debian 13; blackbox_exporter 0.28.0; Prometheus 3.13.2",
  "release_checksums": "pass",
  "probe_success": [
    {"job":"blackbox-dns-contract","instance":"127.0.0.1:15353","value":"1"},
    {"job":"blackbox-http-contract","instance":"http://127.0.0.1:18080/","value":"1"},
    {"job":"blackbox-https-contract","instance":"https://127.0.0.1:18443/","value":"1"}
  ],
  "https_status": 200,
  "tls_full_days_remaining": 13,
  "alerts": [
    {"name":"BlackboxTLSExpiresSoon","state":"firing","instance":"https://127.0.0.1:18443/"}
  ]
}
The representative receipt proves configuration behavior, not universal availability. All targets sit on one host, so the lab cannot demonstrate regional reachability, Internet routing, or failure-domain independence.
Verify completeness separately from production acceptance
These assertions fail unless all three series are present and green, the HTTP contract saw 200, the certificate is still valid, and the expected expiry alert is firing.
set -euo pipefail
: "${LAB_ROOT:?Run the lab first}"
PROM_API="http://127.0.0.1:${PROMETHEUS_PORT}/api/v1"

curl -fsSG "$PROM_API/query" --data-urlencode 'query=probe_success' | jq -e '.data.result | length == 3 and all(.[]; .value[1] == "1")' >/dev/null
curl -fsSG "$PROM_API/query" --data-urlencode 'query=probe_http_status_code{job="blackbox-http-contract"}' | jq -e '.data.result | length == 1 and .[0].value[1] == "200"' >/dev/null
curl -fsSG "$PROM_API/query" --data-urlencode 'query=probe_ssl_earliest_cert_expiry{job="blackbox-https-contract"} - time()' | jq -e '.data.result | length == 1 and (.[0].value[1] | tonumber) > 0' >/dev/null
curl -fsS "$PROM_API/alerts" | jq -e '[.data.alerts[] | select(.labels.alertname == "BlackboxTLSExpiresSoon" and .state == "firing")] | length == 1' >/dev/null
printf 'verification=PASS protocols=3 http=200 tls=future expiry_alert=firing\n'
Place the Prober Outside the Failure It Must See
When a prober runs on the monitored server, it disappears if that server loses power, routing, or its operating system. For external availability, place at least one Blackbox Exporter and Prometheus path in a different failure domain. Multi-location probes are valuable only when every location label represents a real network viewpoint and alert rules avoid paging several times for one shared dependency.
Production hardening also changes the lab defaults:
- bind exporter and Prometheus web endpoints to private addresses or protect them with the exporter toolkit’s TLS/authentication configuration;
- allow probes only to approved targets so the service cannot become an internal-network scanning relay;
- use dedicated service accounts, read-only configuration, versioned deployments, resource limits, and a tested reload or restart path;
- test body patterns against stable health semantics, not marketing copy or a frequently changing homepage;
- monitor the exporter process, scrape age, and target series absence in addition to explicit
probe_success=0; - keep external probes beside application metrics and logs because each view owns different evidence.
Operators wanting a lighter interface can compare private Uptime Kuma deployment, especially when PromQL and multi-target relabeling would add more operational cost than the environment needs.
Remove Only the Disposable Lab
Stop only PIDs recorded by this lab, verify the random path prefix, and then delete that directory. Package removal is intentionally excluded: dnsmasq-base may predate the lab or be used elsewhere, so uninstalling it would exceed the known cleanup scope.
set -euo pipefail
: "${LAB_ROOT:?LAB_ROOT is not set}"
[[ "$LAB_ROOT" == /tmp/voxfor-blackbox-lab.* && -d "$LAB_ROOT" ]]

for pid_file in "$LAB_ROOT"/*.pid; do
  [[ -f "$pid_file" ]] || continue
  pid="$(cat "$pid_file")"
  [[ "$pid" =~ ^[0-9]+$ ]] || continue
  kill "$pid" 2>/dev/null || true
  wait "$pid" 2>/dev/null || true
done
find "$LAB_ROOT" -depth -delete
test ! -e "$LAB_ROOT"
printf 'cleanup=PASS scope=%s\n' "$LAB_ROOT"
The cleanup guard was itself reproduced. An earlier draft used an unscoped wait, which could include a reporting process and delay removal; the final form waits only for the PIDs read from this lab.
FAQ: Blackbox Exporter Protocol Probes
What does probe_success=1 prove?
probe_success=1 proves that one selected Blackbox Exporter module completed and all conditions configured in that module passed. It does not prove every application workflow, dependency, region, or internal metric is healthy.
Should Blackbox Exporter run on the monitored server?
Local Blackbox Exporter is useful for development, but external-availability evidence needs a prober in another failure domain. A local-only prober disappears with the host and cannot report host-wide loss.
Can one module monitor HTTP, DNS, and TLS?
HTTP probing can include DNS lookup and TLS handshake timing, but separate modules are clearer when the reader needs an exact DNS answer, independent DNS-server targets, or protocol-specific alert ownership. Do not merge contracts merely to reduce YAML.
Does Blackbox Exporter replace application metrics?
No. Blackbox Exporter observes externally visible behavior, while application and host metrics explain internal work and resource state. Use both views to separate a client-visible symptom from its likely owner.
How does Blackbox Exporter monitor TLS expiry?
Successful HTTPS probes expose probe_ssl_earliest_cert_expiry as a Unix timestamp for the earliest certificate expiry in the observed chain. Subtract time() in PromQL and alert before the remaining interval reaches zero.
How should a failed Blackbox probe be debugged?
Call /probe directly with the same module and target, add debug=true, and inspect prober logs. If direct output passes while Prometheus lacks data, check relabeling, scrape address, timeout, and series labels rather than changing the endpoint.
Keep Protocol Ownership in the Monitoring Receipt
Useful blackbox evidence names the prober location, target, module, expected condition, observed metric, timestamp, and alert owner. Preserve those fields with the configuration version that produced them. When an alert fires, the team can then ask which contract failed before restarting services or editing DNS.
One green light is easy to collect. Three narrow, tested contracts are easier to trust.